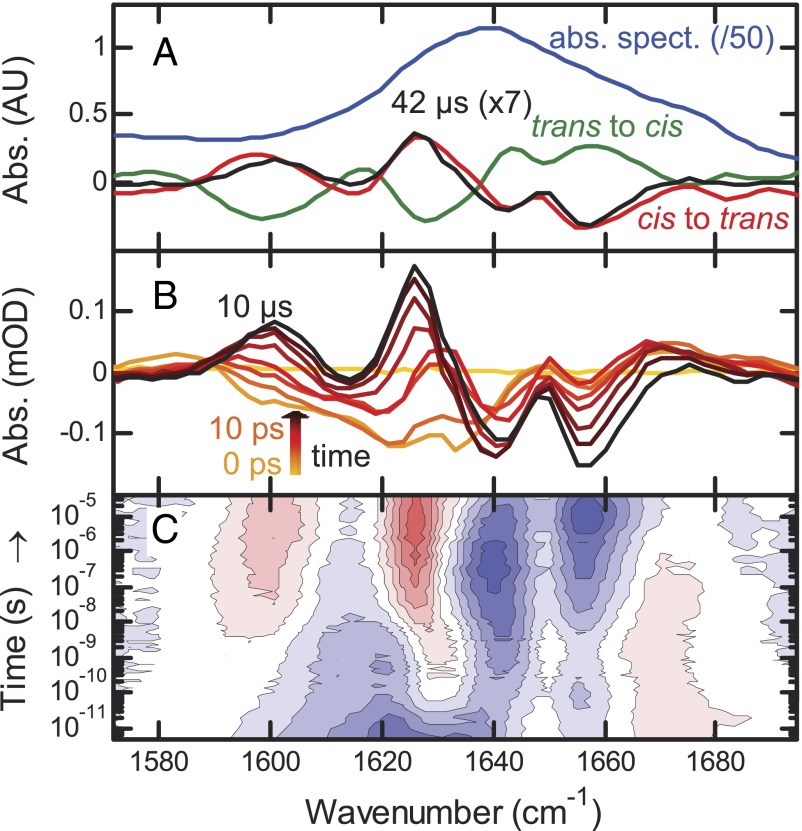
Fig. 2.
(A) Absolute (photoswitch in trans, blue, downscaled by 50) and difference FTIR spectra (red and green) compared with the transient spectrum at 42 μs (black, upscaled by 7). (B) Transient difference spectra at −1 ns (yellow), 0 ps (light orange), and from 10 ps to 10 μs by decade (orange to black). (C) Contour plot of the IR response. Red indicates induced absorption, blue indicates a bleach, and contour lines are equally spaced.

