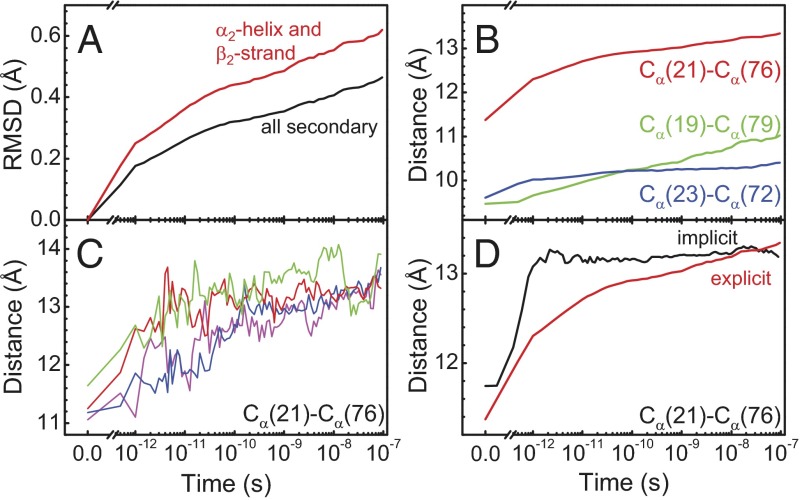
Fig. 4.
MD results. (A) Time evolution of the rmsd, averaged over an ensemble of nonequilibrium trajectories. The rmsd is relative to the averaged starting structure. (B) The same for the Cα-Cα distances across the binding groove, indicated as dotted lines in Fig. 1D. (C) Cα(21)-Cα(76) distance from four typical individual trajectories. A–C were all deduced from explicit water simulations. (D) Comparison of the Cα(21)-Cα(76) distance in simulations performed in explicit (red) vs. implicit (black) water.

