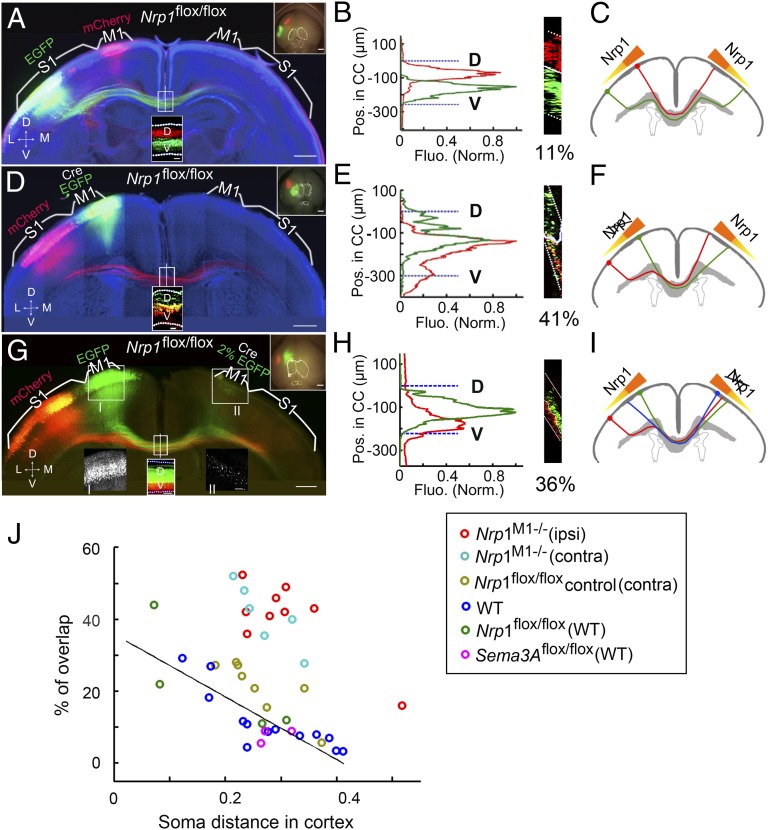
Fig. 5.
Disruption of axon order in Nrp1M1−/− mice. (A and B) A 200-µm coronal section from the brain of a P8 Nrp1flox/flox mouse with mCherry expression in M1 and EGFP expression in S1. Data are presented as in Fig. 1 A and B. No disruption of axonal order was observed in the CC. (C) Schematic diagram of the topographical arrangement of CC axons within the CC corresponding to its contralateral cortical projection. The gradient of Nrp1 in layer II/III neurons in the cortex is in relationship with the axon order within the CC. (D–F) Example of a 200-µm coronal section from P8 Nrp1M1−/− mice with Cre and EGFP expression in M1 and mCherry expression in S1. Data are presented as in A–C. The D–V order within the CC was grossly disrupted. As shown in the schematic diagram (F) the axon order was disrupted when the gradient of Nrp1 was disturbed ipsilaterally, resulting in abnormal but position-dependent contralateral cortical projection. (G–I) Coronal section (200-µm) from P8 Nrp1M1−/− mice, with mCherry in M1 and EGFP expressed in S1 in one hemisphere and Cre expressed together with a low-level of EGFP in the contralateral homotopic M1 that labeled the cell bodies but not axons. (Insets I and II) High-magnification images areas in boxes I and II. The axon order was disrupted compared with control (Fig. S9 E and F and Fig. 5J). As shown in I, the disruption of the Nrp1 gradient disturbed the axon order in the opposite hemisphere in a non–cell-autonomous manner. (J) Plot of percentages of overlap versus cortical distances for data from different experiments. Data from Fig. 1E for control mice (WT, Nrp1flox/flox, and Sem3Aflox/flox) are included for comparison with data from mice in which Sema3A/Nrp1 signaling was manipulated. Nrp1M1−/− (ipsi), mice with Nrp1 deletion in ipsilateral cortex (n = 9); Nrp1M1−/− (contra), mice with Nrp1 deletion in the contralateral cortex (n = 6); Nrp1flox/flox (contra), mice expressing lower level of EGFP in the contralateral M1 without Nrp1 deletion (n = 8). (Scale bars, 500 μm for A, D, and G.) Dotted white lines indicate the CC border.

