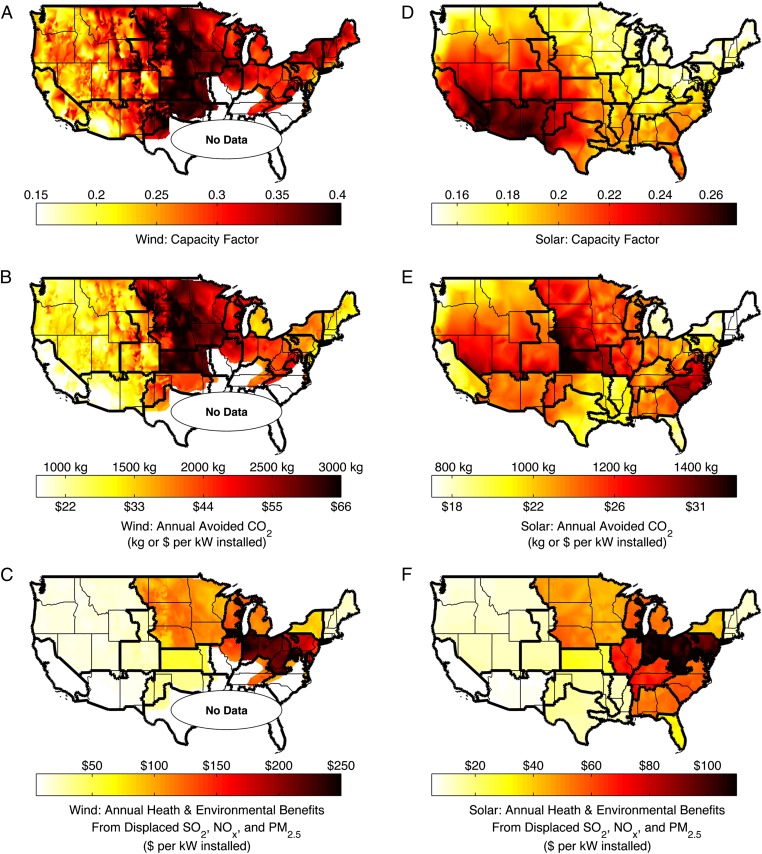
Fig. 1.
Performance of wind turbines (A–C) and solar panels (D–F) relative to three objectives: capacity factor, a measure of energy output (A and D); annual avoided CO2 emissions and the corresponding social benefits, assuming a social cost of $20 per ton of CO2 (B and E); and annual health and environmental benefits from displaced SO2, NOx and PM2.5 emissions (C and F). Because of data limitations, the eastern part of Texas and the Southeast are excluded from our assessment of wind energy. Sharp boundaries are due to the assumption that wind and solar only affect generators within the same eGRID subregion (i.e., imports and exports of electricity between regions are ignored). Monetary values are in 2010 dollars.

