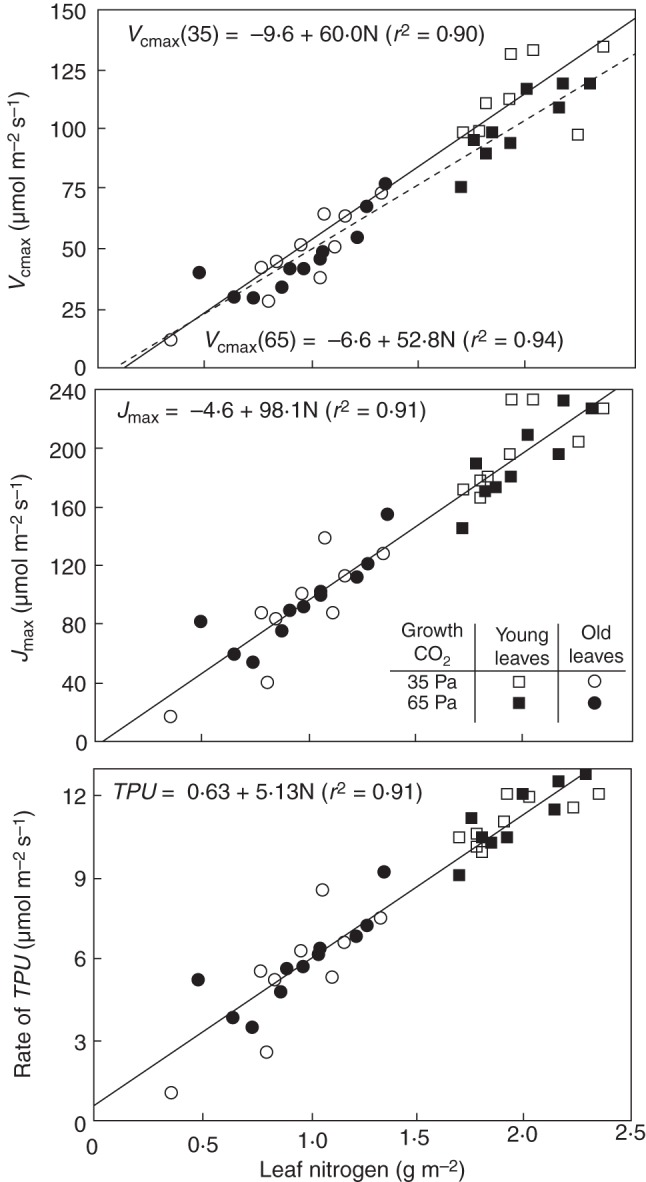
Fig. 2.

Estimates of photosynthetic parameters Vcmax, Jmax and TPU plotted as a function of leaf N in cotton plants. Squares, estimates obtained from recently fully expanded leaves; circles, from leaves up to 18 d after full expansion. For Vcmax, independent linear regressions were obtained for leaves of plants grown in 35 (open symbols) and 65 Pa CO2 (filled symbols); regressions for Jmax and TPU data are based on combined 35 and 65 Pa data (reproduced from Harley et al., 1992) with permission.
