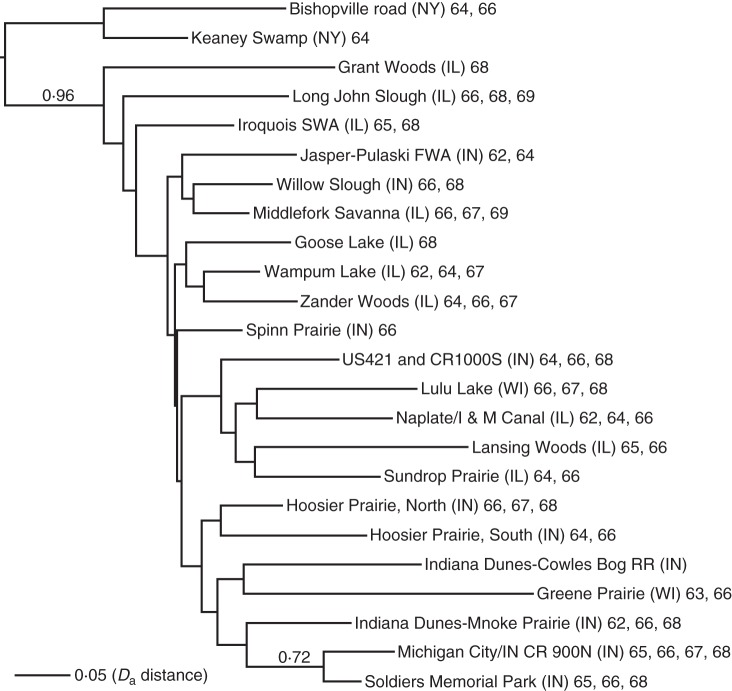
Fig. 2.
Neighbor–joining (NJ) tree from the Da distance matrix of 24 populations from the Chicago and Northeastern regions sample (461 individuals in total). Bootstrap values are shown above branches that have support >0·5. Each tip is labelled with the population name and chromosome numbers. This tree has been rooted using the populations from Northeastern region.

