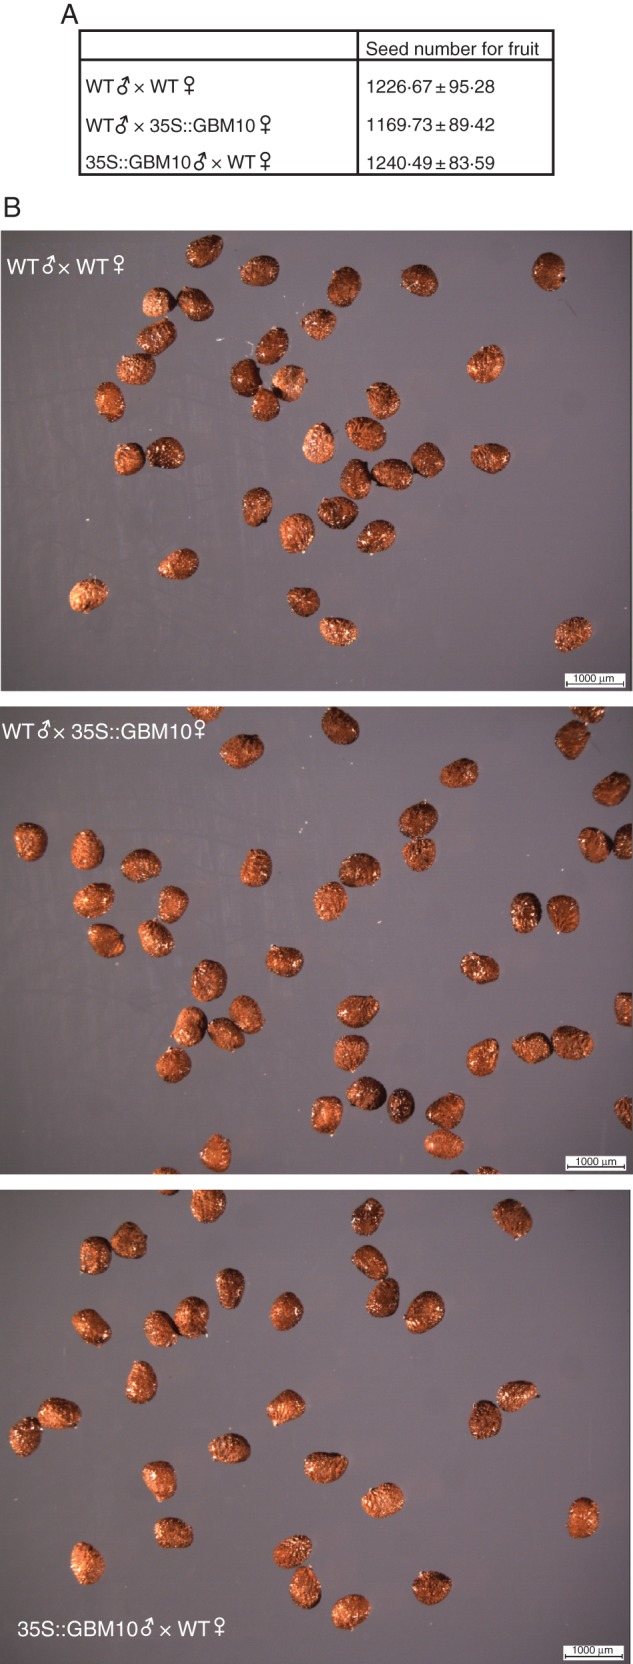
Fig. 7.

Seeds obtained from cross-pollination experiments. The table in (A) shows the average number of seeds per fruit. For each cross, the seeds of five different capsules were counted. The values are given with the standard deviation. Seeds obtained from the various cross-pollination experiments are shown in (B). Scale bar = 1000 µm.
