
Fig. 2.
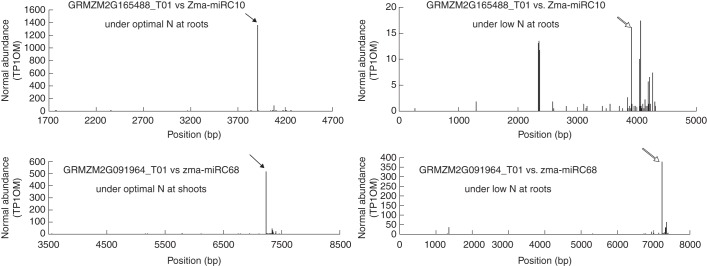
Distribution of the 5′ end of the degradome tags within the full-length target gene sequence. The solid arrows indicate the abundance peaks in the optimal-nitrate condition, while the open arrows indicate the abundance peaks in the low-nitrate condition in maize roots or shoots.