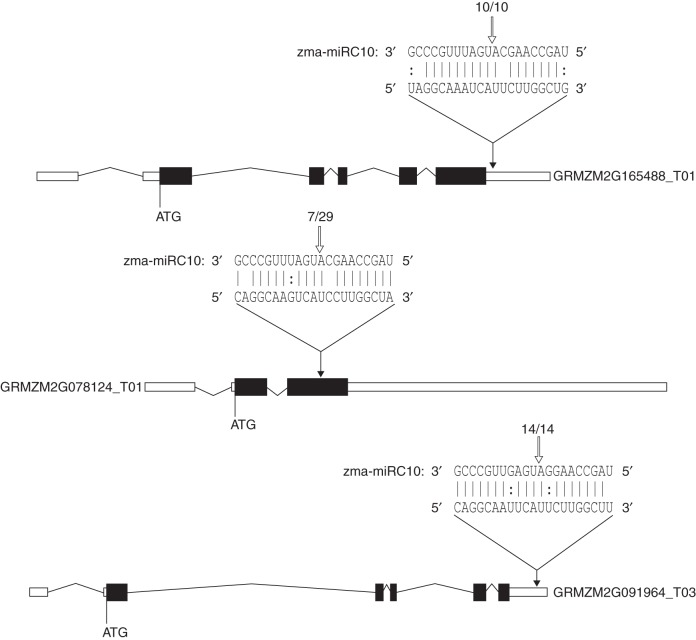
Fig. 3.
Experimental validation and diagram of the cleavage site (open arrow) of GRMZM2G165488 (top) and GRMZM2G078124_T01 (middle) with miRC10 and of GRMZM2G091964 with miRC68 (bottom) mediated by miRNA in the gene structure using 5′-RACE assay. Alignment of miRC10 and miRC68 with a portion of their target sequence (top) and distribution of the 5′ end of the degradome tags within the full-length target gene mRNA sequence (bottom) corresponding to their targets. The black arrows indicate the cleavage sites in the gene structure. The open arrow indicates the cleavage site validated by RLM-RACE at the target site. For numbers and slashes, the first number is the frequency of validated events detected in the sequenced tags, and the second number is the total number of events.

