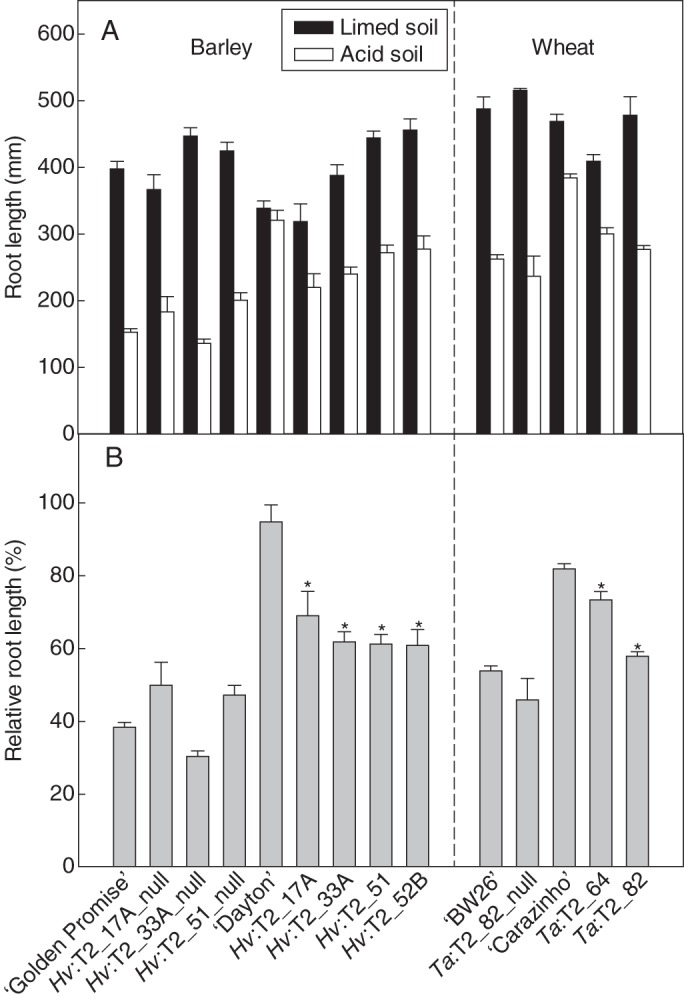
Fig. 3.

Relative root length of transgenic T2 barley and wheat lines grown in soil. (A) Combined length of the two longest roots from barley and wheat plants grown in acid and limed soils for 6 d. Data show the mean and standard error (n = 6). (B) Relative root length (RRL) of barley and wheat lines. RRL is calculated as the length of the two longest roots in acid soil expressed as a percentage of the two longest roots in limed soil. Transgenic lines, null lines and other control lines are indicated as for Fig. 2. Data show the mean of RRL and the accumulated standard error (n = 6). For the barley results, asterisks above transgenic lines Hv:T2_17A, Hv:T2_33A and Hv:T2_51 indicate significant differences from their respective null lines at each Al3+ concentration (P < 0·05). Asterisks above line Hv:T2_52B indicate significant differences from all the null lines. For the wheat results, asterisks above the transgenic lines Ta:T2_64 and Ta:T2_82 indicate significant differences from the null line Ta:T2_82_null (P < 0·05).
