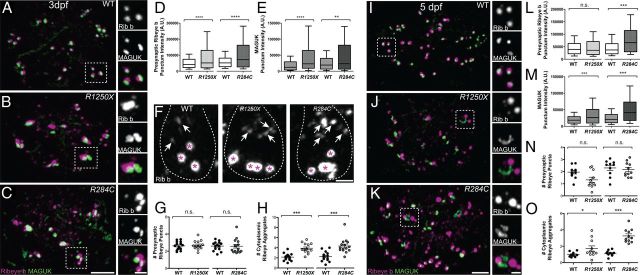
Figure 2.
Characterization of ribbon-synapse morphology in cav1.3a mutants at 3 and 5 dpf. A–C, Representative images of Ribeye b (Rib b) and MAGUK immunolabel in NM (position 1) hair cells of a 3 dpf WT (A), R1250X (B), and R284C larva (C). Scale bars: main panels, 3 μm; right panels, 1 μm. D, E, Box plots of puncta intensities in 3 dpf cav1.3a mutant and WT NM1 hair cells. Whiskers indicate the 10th and 90th percentiles. Each plot represents a population of intensity measurements of individual labeled punctum collected from NM1 hair cells of 14–15 individual larvae. D, Intensities of presynaptic Ribeye b. Mann–Whitney U test, ***p < 0.0001 for both mutant alleles. E, Intensities of postsynaptic MAGUK. Mann–Whitney U test, ***p < 0.0001 and **p = 0.0025, respectively. F, Side views of Ribeye b in 3 dpf WT and cav1.3a mutant hair cells. Hair cells are delineated with a dashed outline. White arrows indicate Ribeye aggregates in the cell body; magenta asterisks indicate presynaptic ribbons. Scale bar, 1 μm. G, H, The number of presynaptic and extrasynaptic Ribeye b aggregates per hair cell in 3 dpf WT and cav1.3a mutants. Each circle represents NM1 within a larva. The number of puncta per hair cell was approximated by dividing the number of Ribeye puncta within an NM by the number of hair cells in the NM. Error bars are SEM. G, Number of presynaptic Ribeye b puncta. Unpaired t test, p = 0.6876 and 0.9290, respectively. H, Number of cytoplasmic Ribeye b aggregates. Unpaired t test, ***p < 0.0001 for both mutant alleles. I–K, Representative images of Ribeye b and MAGUK label in NM2 hair cells of a 5 dpf WT (I), R1250X (J), and R284C larva (K). Scale bars: main panels, 3 μm; right panels, 1 μm. L–M, Box plots of puncta intensities in 5 dpf cav1.3a mutant and WT sibling NM2 hair cells. Whiskers indicate the 10th and 90th percentiles. Each plot represents a population of intensity measurements collected from NM2 hair cells of 10–11 individual larvae. L, Intensities of presynaptic Ribeye b. Mann–Whitney U test, p = 0.6138 and ***p < 0.0001, respectively. M, Intensities of postsynaptic MAGUK. Mann–Whitney U test, ***p < 0.0001 for both mutant alleles. N–O, The number of presynaptic and extrasynaptic Ribeye b aggregates per hair cell in 5 dpf WT and cav1.3a mutants. Each circle represents NM2 within an individual larva. Error bars are SEM. N, Number of presynaptic Ribeye b puncta. Unpaired t test, p = 0.0611 and 0. 6214, respectively. O, Number of cytoplasmic Ribeye b aggregates. Unpaired t test, *p = 0.03 and ***p = 0.0001, respectively.

