Figure 9.
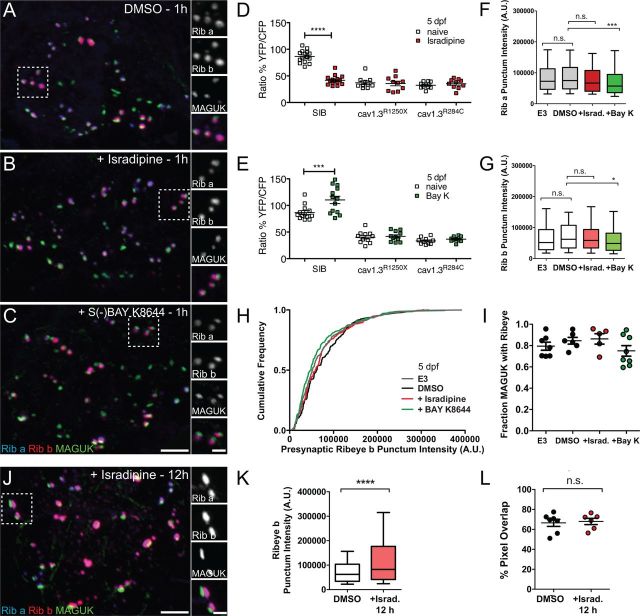
Relatively mature hair-cell synapses in 5 dpf larvae are less susceptible to pharmacological manipulation of L-type calcium channels. A, Representative confocal images of Ribeye a (Rib a), Ribeye b (Rib b), and MAGUK immunolabel in NM2 of 5 dpf larvae exposed to 0.1% DMSO alone (control, A), 10 μm isradipine (B), or 10 μm S-(−)Bay K8644 (C) for 1 h. Scale bars: main panels, 3 μm; right panels, 1 μm. B, Ribeye labeled puncta appear comparable with control-treated larvae after 1 h exposure to isradipine. C, Ribeye labeled puncta appear somewhat less intense in S-(−)Bay K8644-treated NMs compared with controls. D, E, Scatter plots depict the average Ca2+ response per NM in WT and cav1.3a mutants at 5 dpf (white squares) and after Bay K8644 (red squares) or isradipine (green squares) treatment. n ≥ 4 fish and n ≥ 10 NMs per genotype. Error bars are SEM. ***p < 0.001, ****p < 0.0001, defined by a paired t test. SIB, Sibling. F, G, Box plots of puncta intensities in 5 dpf NM2 hair cells treated with buffer alone (E3), 0.1% DMSO, 10 μm isradipine, or 10 μm S-(−)Bay K8644 for 1 h. Whiskers indicate the 10th and 90th percentiles. Each plot represents a population of intensity measurements collected from NM1 hair cells of 11–13 individual larvae. *p < 0.05, ***p < 0.0001, defined by the Dunn's multiple comparison test. H, Cumulative frequency distribution of Ribeye b presynaptic puncta intensities in 5 dpf hair cells treated with E3 (gray), DMSO (black), isradipine (red), or Bay K8644 (green). I, Ratio of PSDs (MAGUK immunolabel) with adjacent presynaptic ribbons within an NM. Each circle represents NM2 in an individual larva. There are no significant difference in the ratio of intact ribbon synapses within hair cells of drug-treated larvae versus control (one-way ANOVA, p = 0.3762). J, Representative confocal images of Ribeye a, Ribeye b, and MAGUK label in NM2 after exposure to 10 μm isradipine for ≥12 h. Scale bars: main panels, 3 μm; right panels, 1 μm. K, Intensity of presynaptic Ribeye b puncta (Mann–Whitney U test, ***p < 0.0001). Note the significant increase in Ribeye b label at 5 dpf, indicating that long-term block of Cav1.3a can induce changes in ribbon size at comparatively mature stages. L, Percentage of MAGUK-label containing pixels overlapping with Ribeye b in 5 dpf control and isradipine-treated NM hair cells. Each circle represents an NM in an individual larva. Error bars are SEM.

