
Figure 3.
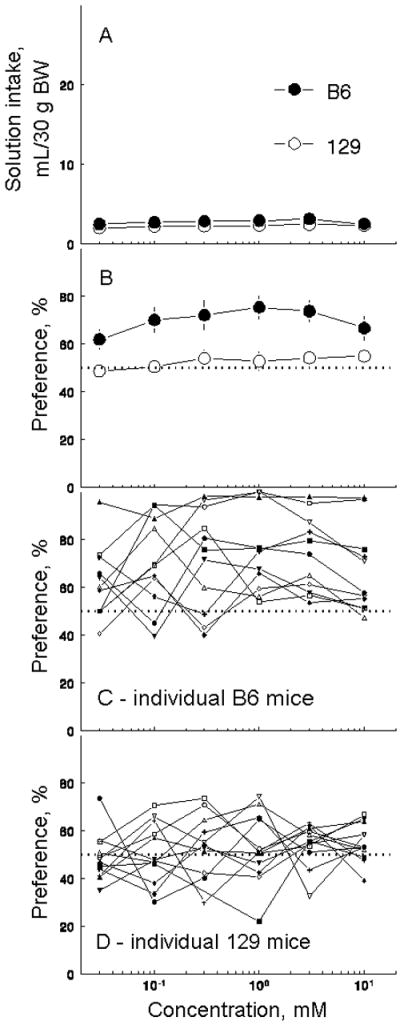
Aspartame solutions intakes and preferences by B6 and 129 mice. (A) Solution intakes, strain means ± SE. (B) Solution preferences, strain means ± SE. (C) Solution preferences by individual B6 mice. (D) Solution preferences by individual 129 mice.