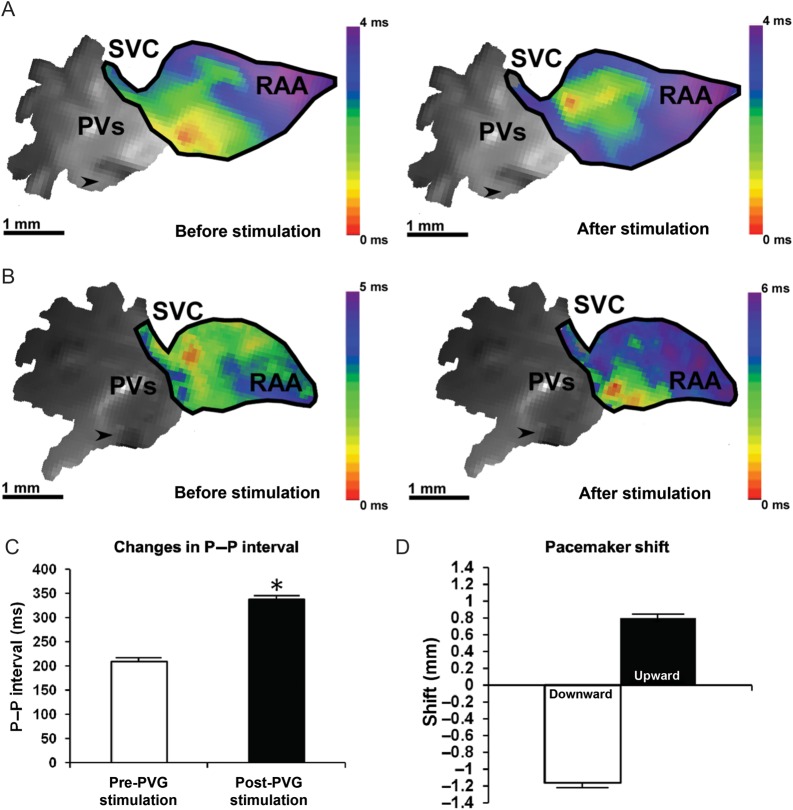
Figure 4.
Modulation of the SAN activation pattern induced by PVG stimulation. The leading pacemaker site shifted upwards (A) in 31.8% of observations (seven of 22), after applying 1000 ms train of stimulation to the PVG. (B) A representative example of a downward shift after PVG stimulation. This took place in 68.2% of observations (15 of 22). (C) The increase in cycle length after 1000 ms trains. The quantification of the shift in the site of earliest activation is in (D). N = 8 hearts, n = 32 observations. SVC, superior vena cava; PV, pulmonary veins; RAA, right atrial appendage; arrows point towards the tip of the stimulation electrode. Colour bars in (A) and (B) display the activation time in milliseconds.

