Figure 1.
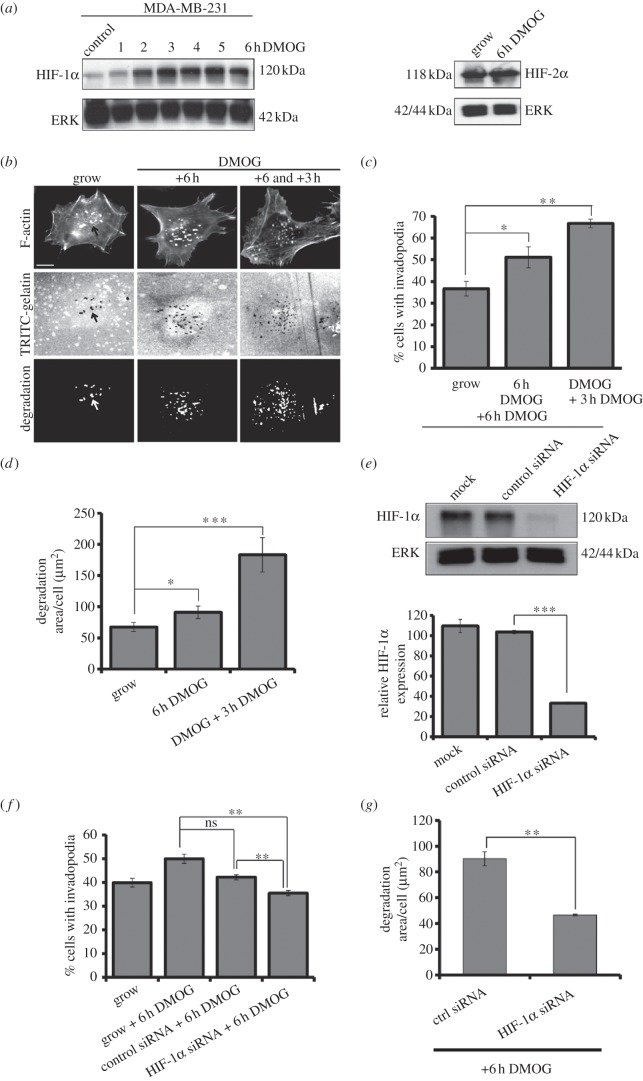
DMOG treatment increases invadopodia formation. (a) MDA-MB-231 cells were stimulated with DMOG. Cell lysates were probed for HIF-1α expression and HIF-2α expression with total ERK used as a control. These results are representative of three independent experiments. (b) Cells were stimulated with DMOG for 6 h then seeded on TRITC-gelatin-coated coverslips for 3 h, fixed and stained for F-actin. (c) Cells were scored for the presence of actin spots with underlying gelatin degradation. (d) The gelatin degradation assay results were analysed using ImageJ software. (e) MDA-MB-231 cells were transfected with siRNA oligos as indicated. Cells were then treated with DMOG for 6 h. Cell lysates were probed for levels of HIF-1α and ERK. Relative expression of HIF-1α was measured using densitometric analysis. (f) HIF-1α KD cells were seeded on gelatin-coated coverslips. Cells were scored as 1C. (g) The gelatin degradation assay results were analysed using ImageJ software. In all cases, the results are mean ± s.e.m. of 30 cells from each experimental condition over three separate experiments. Statistical significance was calculated using unpaired, two-tailed t-test. *p < 0.05, **p < 0.005 and ***p < 0.0005. Error bars represent s.e.m. Scale bar = 10 µm.

