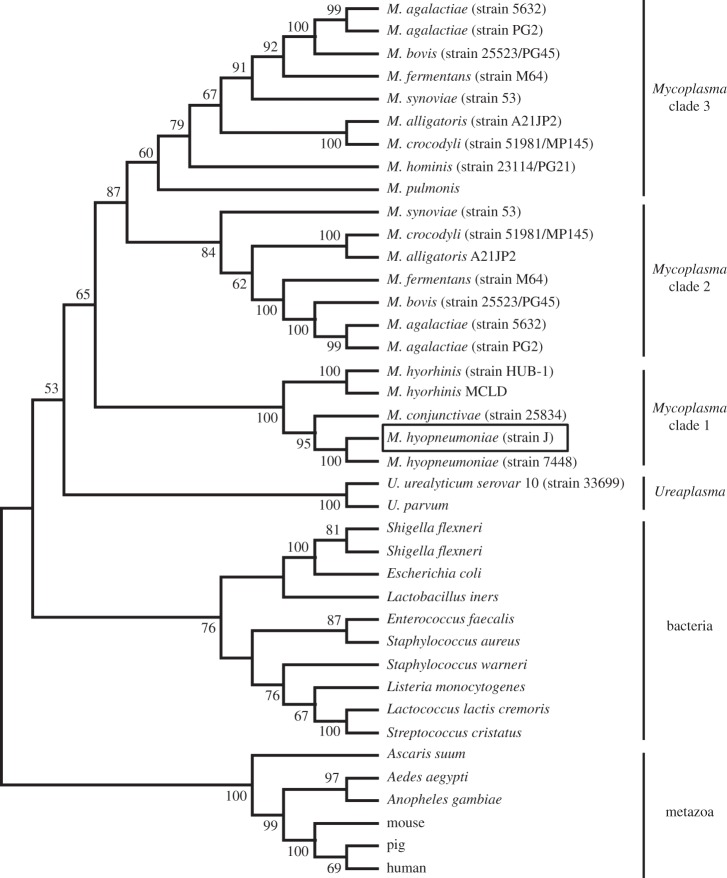
Figure 7.
Bootstrapped (1000 trials) neighbour-joining phylogenetic tree showing the evolutionary relationships of the glutamyl aminopeptidases. Numbers represent bootstrap values (given as percentages) for a particular node, and values greater than 50% are shown. The M. hyopneumoniae M42 glutamyl aminopeptidase characterized in this study is boxed.

