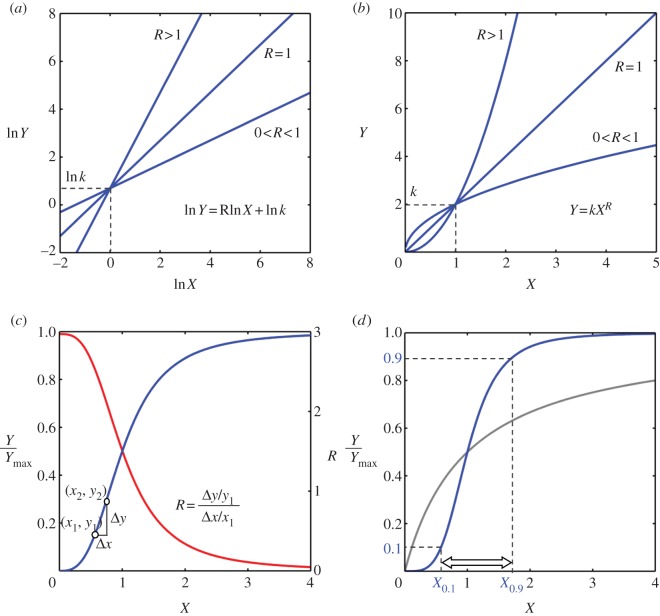
Figure 1.
Response coefficient, shape of ultrasensitive response curve and Hill function. (a) On a log–log scale, if response coefficient R remains constant, proportional, ultrasensitive or subsensitive responses are straight lines of slope of 1, greater than 1 or less than 1, respectively. (b) On a linear scale, if response coefficient R remains constant, a proportional response (R = 1) is a straight line; an ultrasensitive response (R > 1) appears as a curve concave upward and a subsensitive response (0 < R < 1) appears as a curve concave downward. (c) A typical saturable ultrasensitive stimulus–response has a sigmoid appearance (blue curve, left y-axis). Not all regions of the sigmoid curve are ultrasensitive (i.e. capable of percentage amplification). The actual ultrasensitive region corresponds to the range of X where the local response coefficient R (red curve, right y-axis) is greater than 1. (d) Hill function (blue curve) is frequently used to represent an ultrasensitive response. The global steepness of the Hill curve is defined by the Hill coefficient n (see equation 3.5), which quantifies the relative fold change in the level of X that produces from 10 to 90 per cent of the maximum response. The Michaelis–Menten response is plotted as a reference (grey curve).

