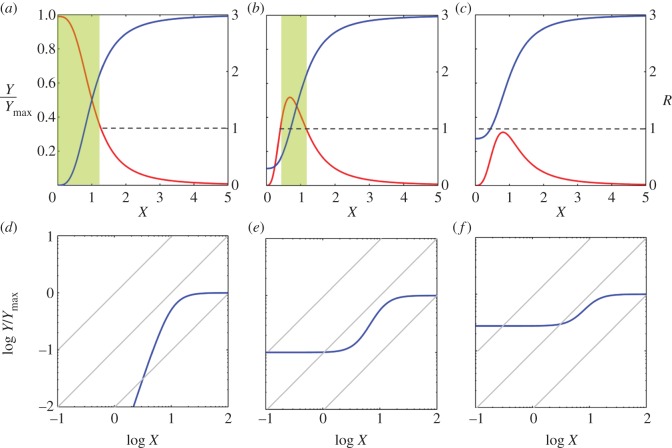
Figure 2.
Effect of basal activity of output on ultrasensitivity. (a–c) Solid blue curves describe the Y/Ymax (left y-axis) versus X stimulus–response as represented by equation 3.7, and red curves are the corresponding response coefficient R (right y-axis). As the basal activity of Y (Y0) increases (from (a) through (c)), the maximum response coefficient decreases. The actual ultrasensitive regions are marked by the shaded areas, which have response coefficients of more than 1. The sigmoid response curve in (c) loses ultrasensitivity completely. (d–f) Blue stimulus–response curves in (a–c) re-plotted on a log–log scale, respectively. The degree of ultrasensitivity can be visually assessed by comparing the slopes of the stimulus–response curve with a series of straight lines of slope of unity (grey lines). Ultrasensitivity is indicated when a section of the curve is steeper than the straight lines.

