Figure 4.
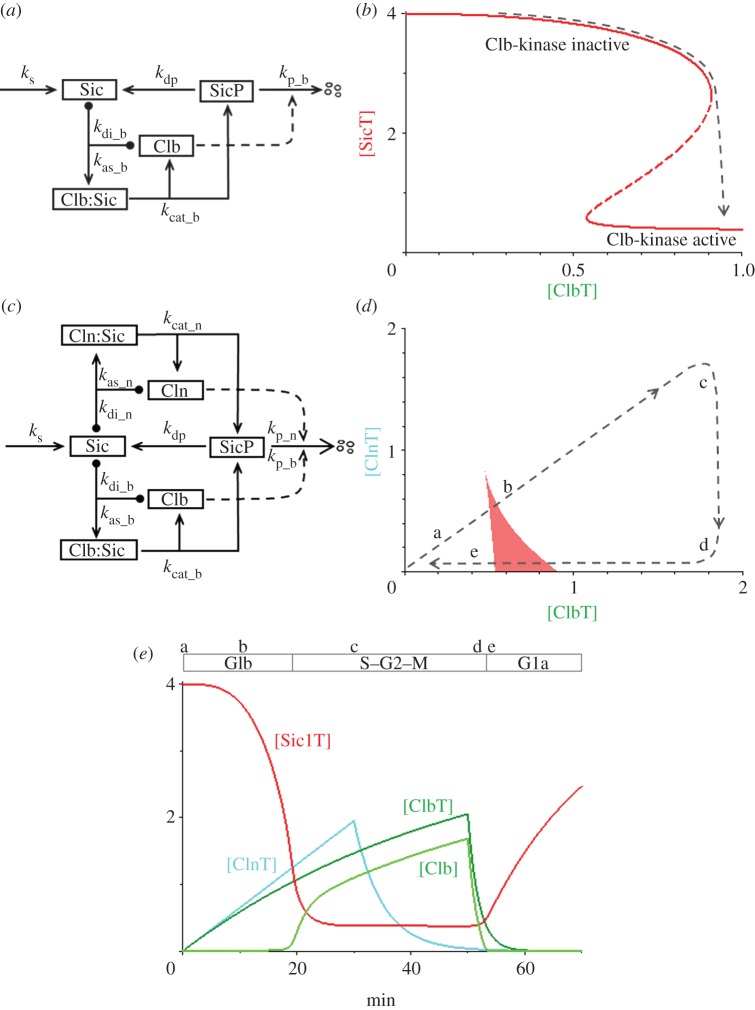
The Sic1-cyclin switch in budding yeast. (a) Wiring diagram for Sic1 and Clb (B-type cyclins). Sic1 is a substrate and inhibitor of Clb-dependent kinase. The second phosphorylation of Sic1 leads to its rapid degradation. (b) Signal–response curve. The total concentration of Sic1 in the cell (a variable) depends, in a bistable manner, on the total concentration of Clb cyclins in the cell (a parameter, in this model). The black dashed line indicates how the switch flips from the Clb-inactive state to the Clb-active state as [ClbT] increases. (c) Wiring diagram for Sic1, Clb and Cln (G1-type cyclins). Sic1 is a substrate—but not an effective inhibitor—of Cln-dependent kinase. (d) Control plane, [ClnT] versus [ClbT]. The V-shaped bistable zone is coloured red. The ‘cell cycle trajectory’ (path a–b–c–d–e) is explained in the text. (e) Simulation of the G1b/S transition in budding yeast, and resetting the checkpoint at cell division. Equations (3.13)–(3.16) are solved numerically for the parameter values in table 2d, and with additional differential equations for the synthesis and degradation of ClnT and ClbT. The synthesis terms for ClnT and ClbT are turned on at t = 0 (the Start transition); at t = 30 min, synthesis of ClnT is turned off and degradation is turned on; at t = 50 min (cell division), synthesis of ClbT is turned off and degradation is turned up. The G1/S transition takes place at t ≈ 20 min, when the cell cycle trajectory passes point b in (d), and there is enough active Clb-kinase to trigger DNA replication. About 50 min after Start, the cell divides and the G1 phase is re-established.

