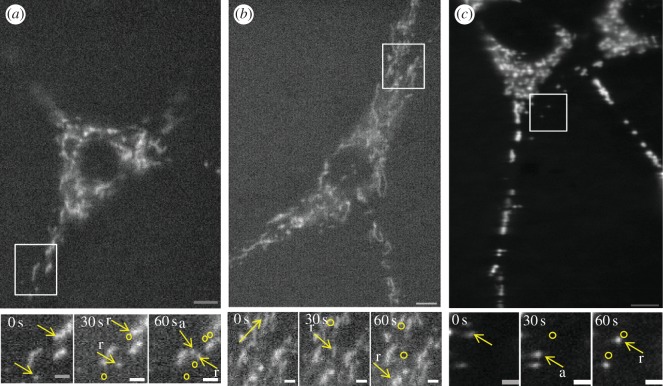
Figure 2.
Time-lapse microscopy of mitochondrial distribution and motility of 3T3 cells transfected with (a) KBD after 12 h, (b) R2KR3 after 15 h or (c) non-transfected cells (NT). Lower panels are higher magnifications of still images at three different time points taken from movies of regions of interest (insets) depicted in the upper panels. Yellow arrows represent mitochondria undergoing retrograde (r) or anterograde (a) motility. Circles depict prior coordinates (positions) of mitochondria. Movies of upper and lower panel images are shown in the electronic supplementary material. Scale bars of upper and lower panels are 13 and 4 μm, respectively.

