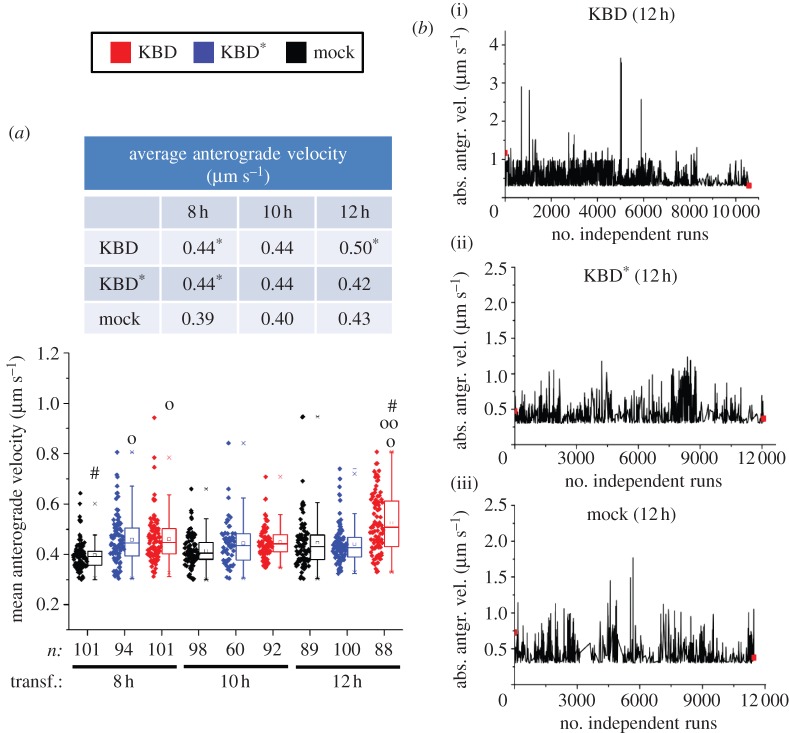
Figure 4.
Upregulation of mitochondrial velocities by KBD of RanBP2. (a) Dot-box plot analyses of mean anterograde velocity of mitochondria. KBD compared with KBD* and mock-transfected cells temporally increases the mean anterograde velocity of mitochondria at 12 h post-transfection. The table accompanying the dot-box plot represents the corresponding median values for the represented dataset. (b) Sparkline analyses of absolute velocity peaks of mitochondrial runs of (i) KBD, (ii) KBD* and (iii) mock-transfected cells after 12 h of transfection show the presence of high-velocity peaks reaching 3.8 µm s−1 only in KBD-transfected cells. Asterisks in medians denote significant differences (Mood's median test, α = 0.01); symbols ‘o’, ‘oo’ and hash are mitochondrial pools significantly different from non-transfected (‘o’), KBD* (‘oo’) and other times of transfection with the same construct (hash); n, number of mitochondria; Mock, mock-transfected; KBD and KBD* are wild-type and mutant kinesin-binding domain of RanBP2, respectively; transf., post-transfection time. (a) Mann-Whitney test, p < 0.001.

