Figure 2.
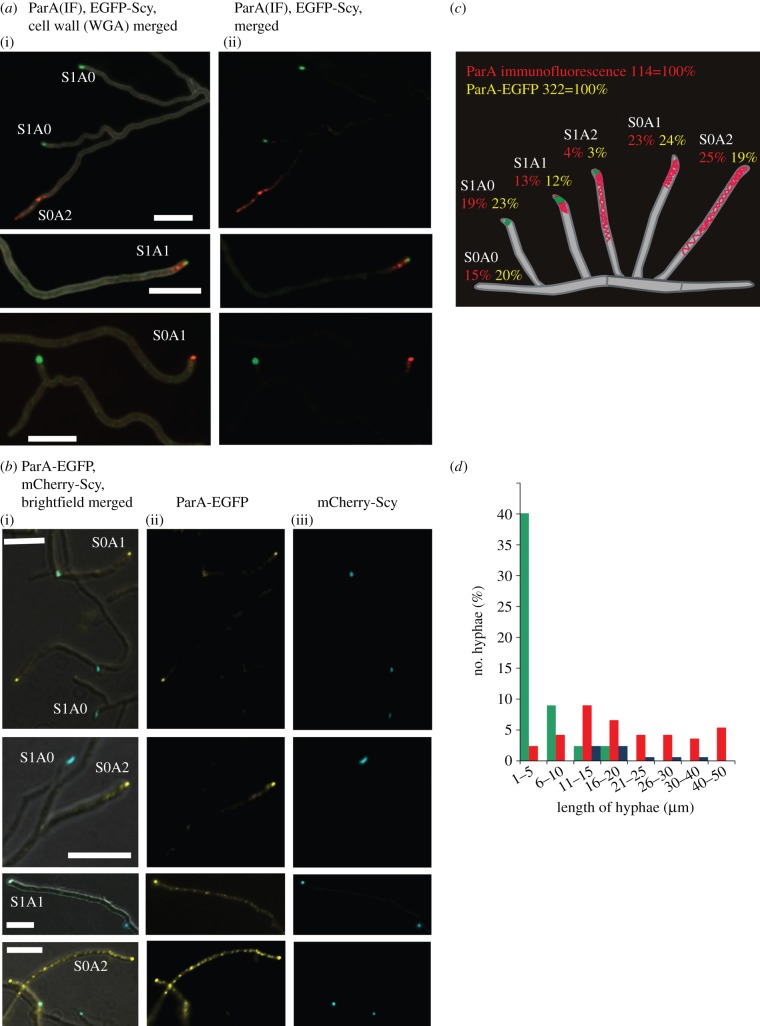
Co-localization of ParA and Scy. (a) Images showing aerial hyphae of a strain expressing egfp-scy; (i) merged fluorescence of cell wall staining with WGA-AlexaFluor 350 (grey), ParA immunofluorescence (red), EGFP-Scy (green), and (ii) merged fluorescence of ParA immunofluorescence (red) and EGFP-Scy (green). Alphanumeric abbreviations indicate hyphae with particular Scy and ParA signals, as described in the text and shown in (c). Scale bars, 5 μm. (b) Images showing aerial hyphae of a strain expressing parA-egfp and mcherry-scy; (i) fluorescence EGFP-ParA (false coloured yellow), mCherry-Scy (false coloured blue) merged with the Nomarski contrast image; (ii) EGFP-ParA (false coloured yellow); and (iii) mCherry-Scy (false coloured blue). Alphanumeric abbreviations indicate hyphae exhibiting particular fluorescent signal of Scy and ParA as described in the text and shown in (c). Scale bars, 5 μm. (c) Statistical analysis of Scy and ParA co-localization. Drawings of Streptomyces hyphae including percentages of aerial hyphae showing the particular patterns of ParA and/or Scy fluorescence, as indicated by the alphanumeric abbreviations. (d) Statistical analysis of the correlation between hyphal length and the ParA–Scy balance. Plot shows the frequency of occurrence of hyphae with specific lengths in relation to various ParA or Scy fluorescence signals. Green bar, Scy; red bar, ParA; blue bar, Scy + ParA.

