
Figure 5.
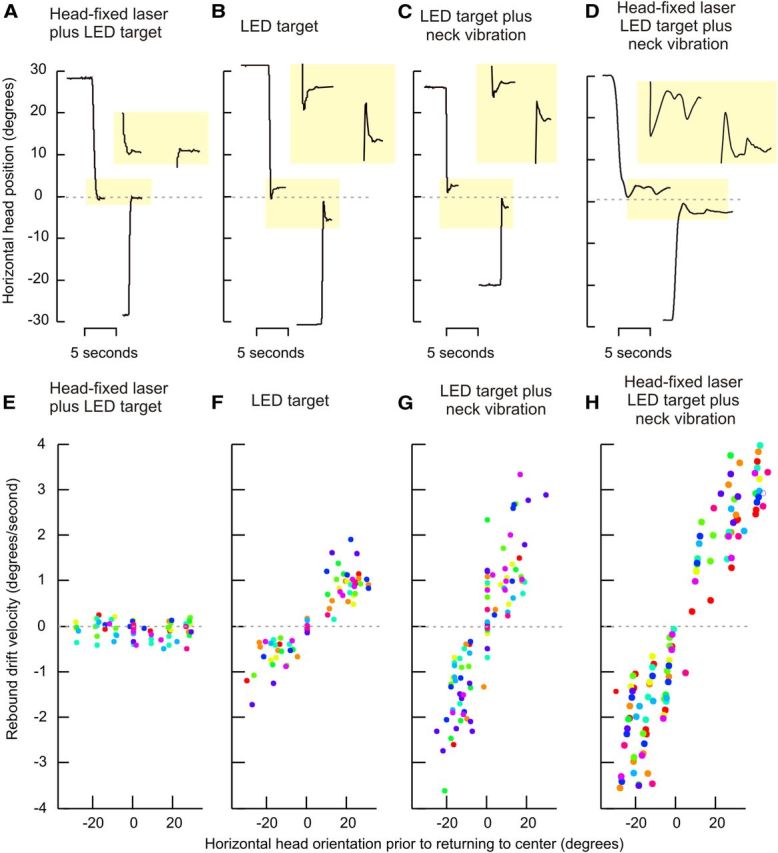
Rebound head nystagmus. A–D depict the head dynamics for a typical normal subject under each of the four test conditions. A depicts the condition with the head-fixed laser aimed at the LED light; the head was stable during both eccentric positions and after returning to the midline. B shows the condition with LED target but no laser. The addition of neck vibration is shown in C, while LED and head-fixed target plus neck vibration is shown in D. In B–D the rebound drifts were apparent when the head returned to the midline (B–D, highlighted yellow boxes). The drifts were not present in the condition including LED target plus laser, but were in the remaining three experimental paradigms. E–H objectively summarize all data from all subjects. The velocities for rebound head drifts are plotted on the y-axis with head position during prior eccentric head position along the x-axis. Each data point represents one rebound drift and each color depicts one subject. The negative values for head orientation depict leftward positions and the negative values for velocities represent leftward drifts. Rebound drifts were always directed opposite those evoked by holding eccentric positions, with positive slopes for all conditions. The data points and positive slope values indicate that leftward rebound drifts were associated with leftward head holding before return to midline, and vice versa.