
Figure 6.
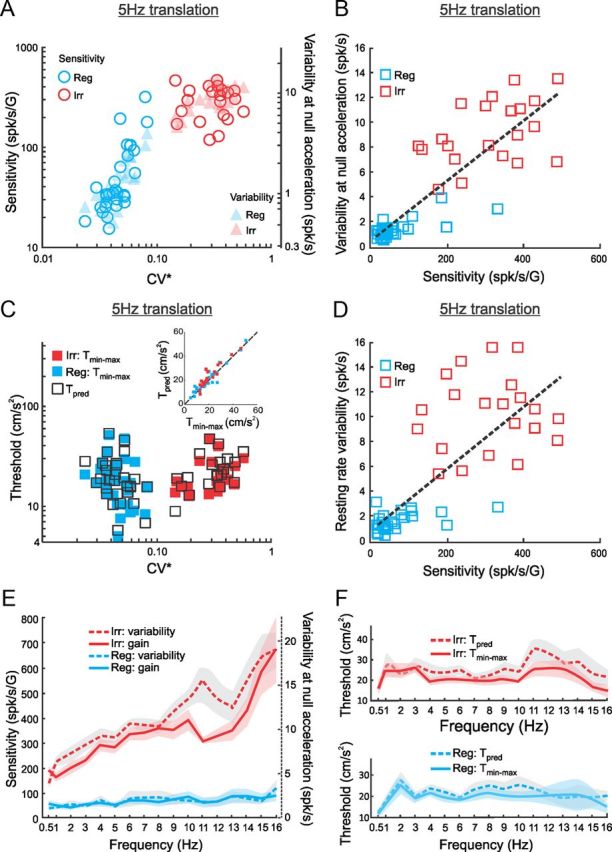
Strong positive correlations between sensitivity and variability lead to discrimination thresholds that are independent of resting discharge regularity and stimulus frequency. A, Response sensitivity as quantified by the slope of the firing rate-head acceleration curve (circles) and variability as quantified by the SD of the firing rate distribution obtained via a Kaiser filter at zero head acceleration (triangles) as a function of CV* for regular (blue, Reg) and irregular (red, Irr) afferents during 5 Hz sinusoidal stimulation. B, Variability as a function of sensitivity for regular (blue) and irregular (red) afferents during 5 Hz sinusoidal stimulation. Both quantities were strongly positively correlated (r = 0.9, p ≪ 10−3). The linear fit to the data (dashed line) had a slope of 0.024 ± 0.009 G and an offset of 0.5 ± 2.3 spikes/s. Importantly, the offset was not significantly different from 0 (p = 0.4), indicating that variability is proportional to sensitivity. C, Comparison between discrimination threshold values Tmin−max for regular (filled blue rectangles) and irregular (filled red rectangles) afferents as a function of CV*. Also shown are the predicted threshold values based on sensitivity and variability (open black rectangles). The inset shows the predicted discrimination threshold values as a function of the actual measured ones. There is excellent agreement because all data points are scattered close to the identity line (dashed line) (R2 = 0.89, the slope of the best-fit straight line is not significantly different from 1, p = 0.44). D, A strong positive correlation between resting rate variability and neuronal sensitivity (r = 0.8, p ≪ 10−3): the slope of the best linear regression was 0.025 ± 0.013 G and the offset (0.99 ± 3.18 spikes/s) was not significantly different from 0 (p = 0.4). Note that resting rate variability was estimated as the SD of the Kaiser filtered firing rate in the absence of any stimulus. E, Population-averaged response sensitivity (solid) and variability (dashed) as a function of linear acceleration frequency for regular (blue) and irregular (red) afferents. F, Population-averaged discrimination threshold values Tmin−max (solid) did not significantly differ from the predicted values (dashed) over the whole frequency range for both regular (bottom) (t test, p > 0.31 for all stimulus frequencies) and irregular (top) (t test, p > 0.15 for all stimulus frequencies) afferents. The shaded bands represent 1 SEM.