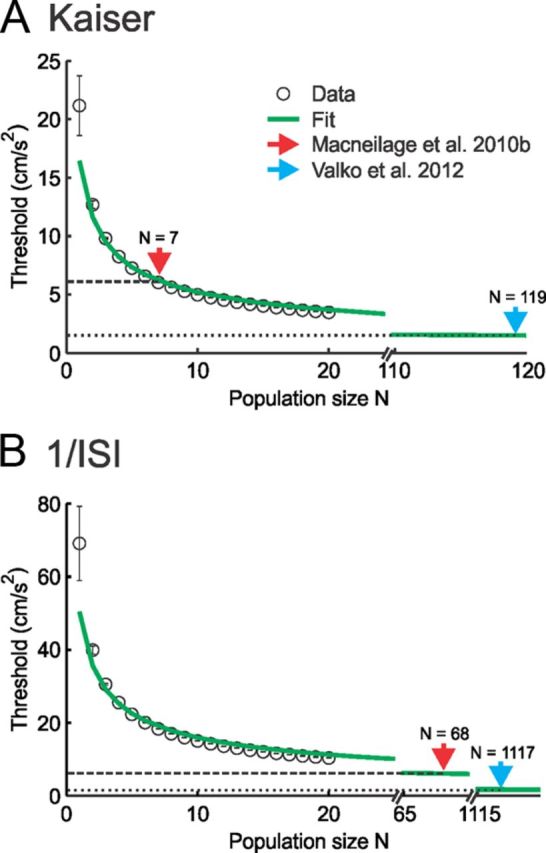
Figure 7.

Pooling the activities of afferent populations of increasing size gives rise to decreasing discrimination threshold values that approach those reported in perceptual studies. A, B, Population-averaged discrimination threshold values (circles) Tmin−max as a function of population size N obtained by estimating the firing rate using either a Kaiser filter (A) or the inverse ISI (B). Also shown are a 1/√N fit (green traces in A and B) as well as perceptual threshold values reported by MacNeilage et al. (2010b) (dashed line) and Valko et al. (2012) (dotted line). In both cases, the data are well fit (A, R2 = 0.93; B, R2 = 0.90), indicating that the discrimination threshold decreases as 1/√N. In both panels, the red and blue arrows give the smallest population sizes that lead to discrimination threshold values that are equal to those reported for perception by MacNeilage et al. (2010b) and Valko et al. (2012), respectively.
