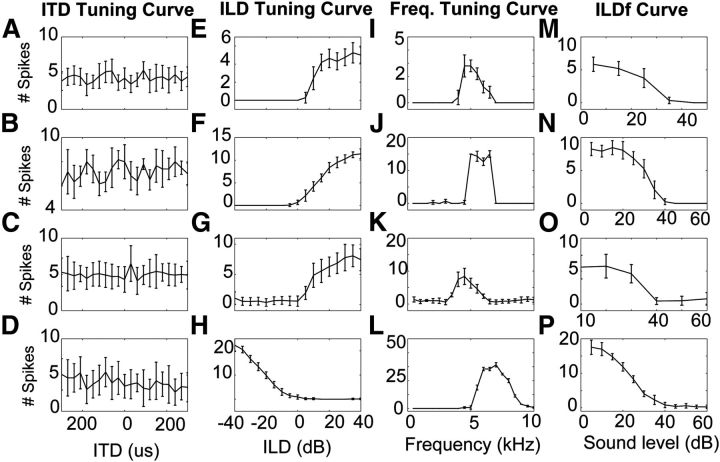
Figure 3.
Example of response properties of four LLDp neurons. Each row represents one neuron. A–D, Rate-ITD curves. (These neurons are not tuned to ITD.) E–H, Rate-ILD curves. I–L, Isointensity frequency-tuning curves. M–P, Rate-ILDf curves, where sound level was held constant in the contralateral (excitatory) ear while it was varied in the ipsilateral (inhibitory) ear as indicated on the x-axis. Neurons in the first three rows were recorded from the left hemisphere, while the neuron recorded in the last row was recorded from the right hemisphere. Therefore, the ILD curve in the last row is reversed relative to the other neurons. Error bars indicate SEM.

