Figure 4.
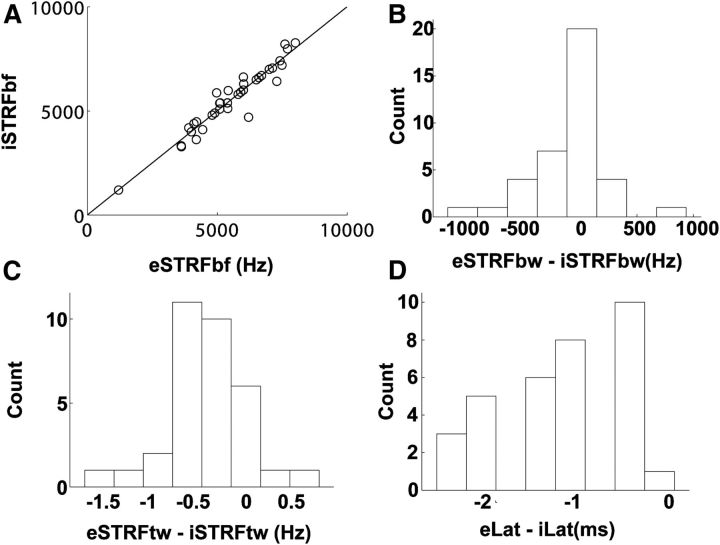
Comparison of monaural excitatory and inhibitory STRF properties. A, eSTRFbf and iSTRFbf were strongly correlated (iSTRFbf = eSTRFbf + 7 Hz, r = 0.96, p < 0.001). B, Distribution of differences in bandwidth (bw) shown as cell counts. iSTRFbw was not significantly broader than eSTRFbw (Kruskal–Wallis test, p > 0.05). C, Distribution of differences in temporal width (tw) shown as cell counts. iSTRFtw was significantly larger than eSTRFtw (Kruskal–Wallis test, p < 0.001). D, Distribution of differences in STRF latency shown as cell counts. The latency of inhibitory STRFs was significantly longer than that of excitatory STRFs (Kruskal–Wallis test, p < 0.001).

