Figure 5.
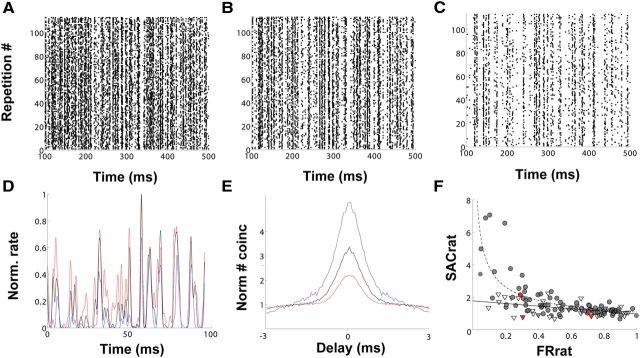
Inhibition enhances response reliability. A–C, Representative rasters of one neuron recorded at an ILD that induced minimal (ILD, 20 dB; A), intermediate (ILD, 10 dB; B), and maximal suppression (ILD, 0 dB; C). D, Overlapped PSTH excerpts of responses depicted in A–C at ILD 20 dB (red), ILD 10 dB (black), and ILD 0 dB (blue). E, Normalized SACs for ILD 20 dB (red), ILD 10 dB (black), and ILD 0 dB (blue). F, Overlapped data comparing the relationship of normalized SAC peak ratios to corresponding firing rate ratios for changing ILDs (filled circles, dashed line; y = 1.09x−0.55, r2 = 0.54, n = 51) and monaural stimulation at different sound levels (triangles, solid line; y = −0.81x + 1.78, r2 = 0.25, n = 38). Data points from the neuron in this figure are highlighted in red. Note that for similar relative decreases in firing rate, proportional changes in response reliability tend to be greater in the presence of inhibition.

