Figure 7.
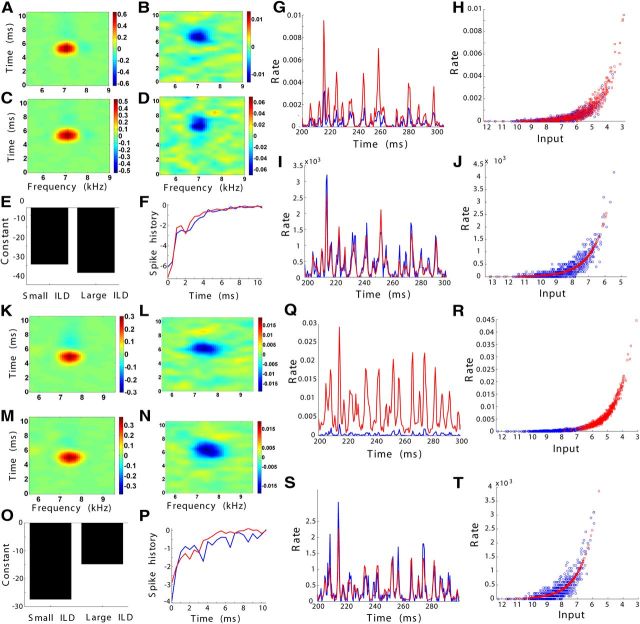
Gain modulation of spectrotemporal selectivity as ILD changes. Examples of the generalized linear model at two ILDs for two neurons and the model responses to frozen noise. Here ILD changes by increasing sound level in the inhibitory ear and decreasing sound level in the excitatory ear. A–F, K–P, The model components show the eSTRFs (left) and iSTRFs (right) for a large ILD (A, B, K, L) and a small, more inhibitory ILD (C, D, M, N). The remaining model components are the constant bias (E, O) and the spike history kernels (F, P). G–J, Q–T, The responses of the models to frozen noise on the right reveal an ILD-dependent gain modulation. G, Q, The rate responses (spikes per trial in 0.5 ms time bins) of the models at an ILD that induced weaker inhibition (red) and an ILD eliciting stronger inhibition (blue) show peaks at similar times. H, R, The input–output functions of the models at the ILDs with (blue circles) and without (red squares) inhibition are similar exponentials, but the inputs lie in different regions. I, J, S, T, Applying a gain modulation to the input at the ILD without inhibition (red) predicts the response to the more inhibitory ILD (blue).

