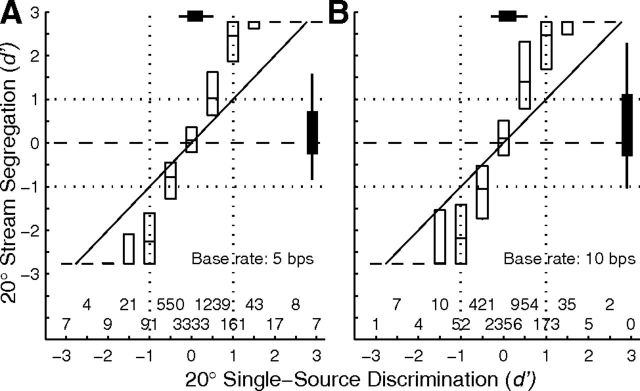
Figure 11.
Comparison of d′ for discrimination of two competing sounds separated by 20° (vertical axis) versus d′ for discrimination of two single sources with the same separation (horizontal axis). A, B, Represent 5 and 10 bps base rates. Single-source data are binned in half-d′ intervals. The two staggered rows of numbers above the abscissa indicate the number of d′ values in each bin. Each unit is represented by 6 d′ values, for B sources 20° to the left and right of A sources at C 40°, 0°, and I 40°. N = 915 units (i.e., 5490 comparisons) at 5 bps and 670 units (4020 comparisons) at 10 bps. Boxes represent medians and interquartile ranges. Median lines without boxes drawn at vertical positions ±2.77 indicate instances in which >75% of the distribution was at d′ = 2.77 or d′ = −2.77. Note that ±2.77 single-source values fall in the ±3-d′ bins.

