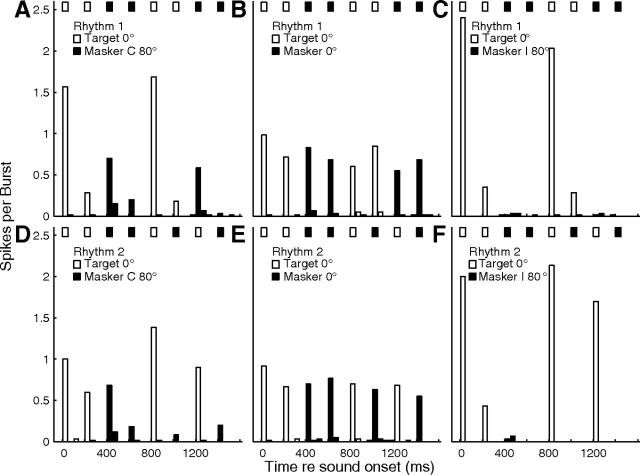
Figure 13.
Unit synchrony to rhythmic stimuli. Plotted are PSTHs for an isolated single unit in response to rhythmic masking-release stimuli (described in the text). Rows of bars at the top of each part indicate rhythms of signal (open) and masker (filled) noise bursts. Open and filled PSTH bars indicate spike rates synchronized to those bursts. The time axis is folded on the 1600 ms rhythm duration, so that each part represents the average across 20 trials × 3 repetitions of the rhythm per trial. Upper and lower rows represent Rhythms 1 and 2, respectively. The signal location was fixed at 0°. Columns represent conditions of masker locations as C 40° (left), 0° (middle), and I 40° (right). Unit 1204.3.25.

