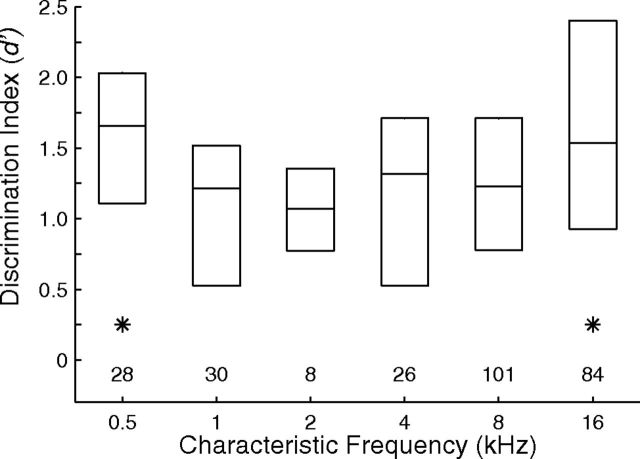
Figure 15.
Dependence of rhythmic masking release performance on CF. Plotted are distributions of d′ for discrimination of rhythms. Signals were fixed at 0°, and the distributions represent for each unit the better of performance for masker locations at C 20° or I 20°. Boxes indicate 25th, 50th, and 75th percentiles. Asterisks indicate 1 oct bins for which medians were significantly higher than those for one or more intermediate frequencies (N = 277 single and multiple units, p < 0.05, corrected for multiple comparisons).

