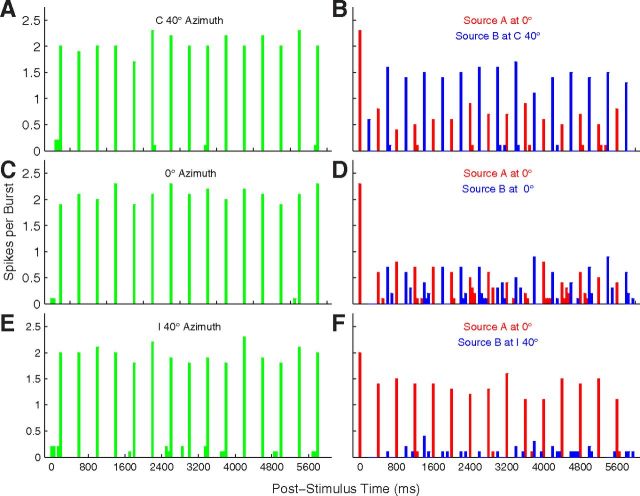
Figure 3.
PSTH of a well isolated single unit. This is the unit represented in Figure 1A. Plotted are responses to sound sequences from a single-source location (left column) or to competing sequences from two locations (right). Responses are spikes per sound burst in 50 ms bins, averaged over 20 trials. In the left column, the sound source was located at C 40° (Fig. 3A), 0° (Fig. 3C), and I 40° (Fig. 3E). In the right column, colors indicate spike rates synchronized to the A source (red) or B source (blue). In all cases, the A source was fixed at 0°, whereas the location of the B source varied from C 40° (Fig. 3B), to 0° (Fig. 3D), to I 40° (Fig. 3F). Unit 1204.3.10.

