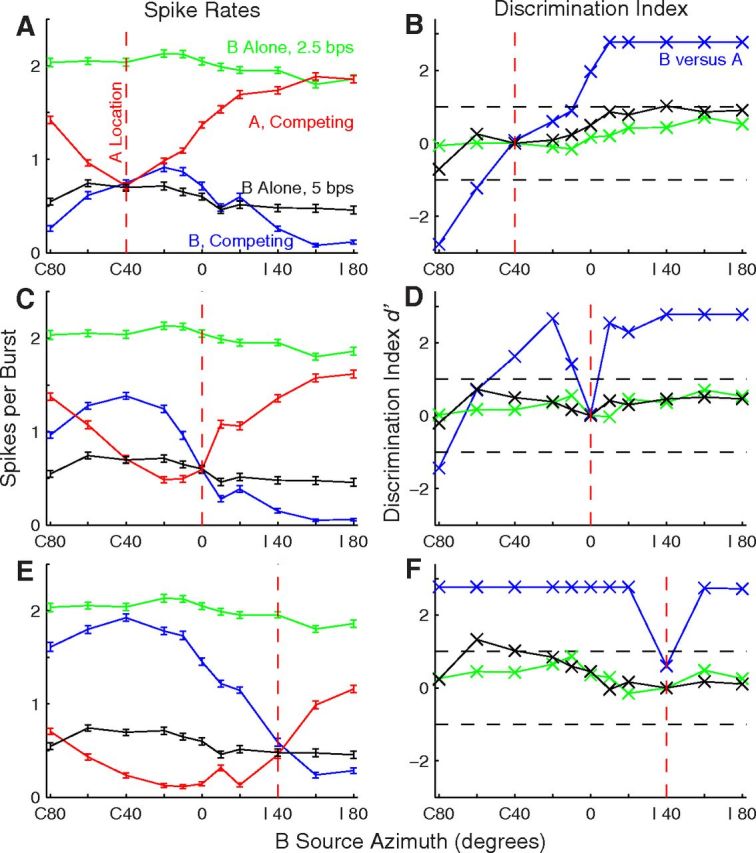
Figure 4.

Stream segregation by an isolated single unit. This is the unit for which RAFs were shown in Figure 1A and PSTHs were shown in Figure 3. The left column (A, C, E) shows mean spike rates (with SEM) as a function of B-source location. Green and black indicate spike rates in Sync2.5 and Sync5 single-source conditions, respectively. Red and blue indicate responses synchronized to A and B sound sources, respectively, in competing-source conditions; the base rate was 5 bps. B-source locations were as plotted, whereas A sources were fixed at the locations indicated by the vertical dashed red lines. Variation in A responses reflects the effect of changing B-source locations. The right column (B, D, F) shows the d′ for discrimination of trial-by-trial spike rates elicited by A versus B sources (blue lines), or for discrimination of spike rates elicited from the plotted location versus those elicited in separate trials from the fixed location indicated by the vertical dashed red line; green and black indicate 2.5 and 5 bps single-source rates, respectively. Unit 1204.3.10.
