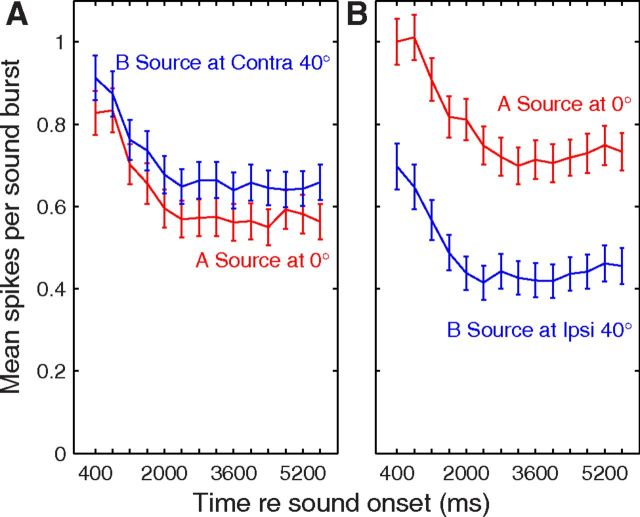
Figure 6.
Spike rates synchronized to the 2nd through 15th bursts from A (red lines) and B (blue) sources as a function of time after onsets of competing sound sequences. Plotted are mean and SEM averaged over 206 well isolated single units. A and B burst times are shown as temporally coincident, although in reality B bursts led and lagged A bursts by 200 ms an equal number of times. The A source was fixed at 0°, and the B source was at C 40° (A) or I 40° (B).

