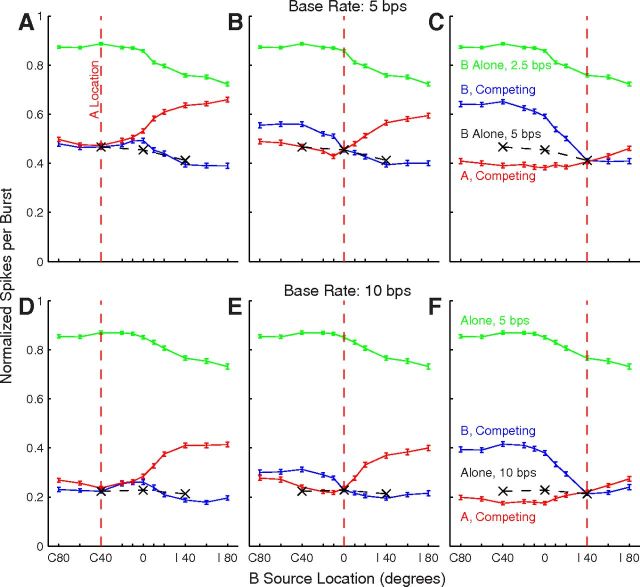
Figure 7.
Grand means of spike rates of 716 (top) or 402 (bottom) units. Plotted are grand-mean response rates (with SEM) for responses to single sources (green), and for responses synchronized to the A (red) or B (blue) source. Black Xs indicates spike counts in conditions in which A and B sources were colocated. The single-source and B-source locations were as plotted on the abscissae, whereas the A sources were fixed at the locations indicated by the vertical red lines: C 40 (A, D), 0 (B, E), and I 40 (C, F). Data from each unit were normalized before averaging according to the peak of each unit's single-source RAF. The peak value of the green line is <1 because the peaks of individual RAFs were not all mutually aligned.

