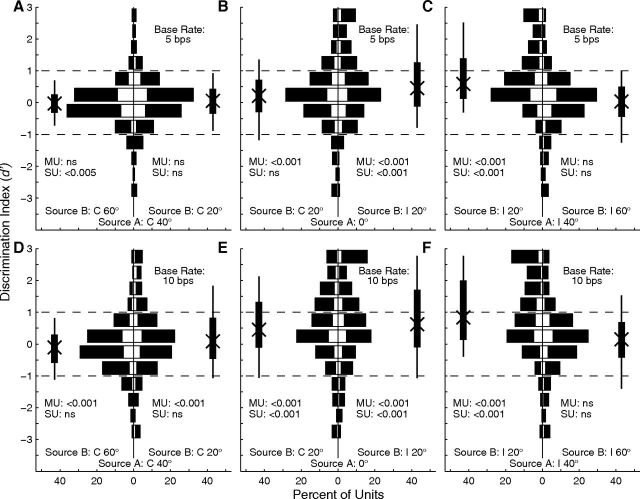
Figure 8.
Distributions of d′ for discrimination of A and B sources. Left (A, D), middle (B, E), and right (C, F) columns correspond to A sources at C 40°, 0°, and I 40°, respectively. Rows represent 5 bps (top) and 10 bps (bottom) base rates. Each part shows two histograms. Bars extending to the left indicate d′ for discrimination of the A source at the stated location from the B source located 20° to the left of (i.e., contralateral to) the source, and bars extending to the right indicate d′ for discrimination from B sources located 20° to the right of the source. Positive values of d′ represent greater spike rates elicited by the more contralateral source. Open and filled portions of bars indicate single and multiple units, respectively. Vertical thick and thin lines indicate interquartile ranges and 10th to 90th percentile ranges, respectively. The Xs on those lines indicate medians. The p values written in each half of each part indicate results of a t test for a mean different from 0, corrected for multiple comparisons (Bonferroni); MU and SU indicate statistics from multiple- and single-unit recordings.

