Figure 4.

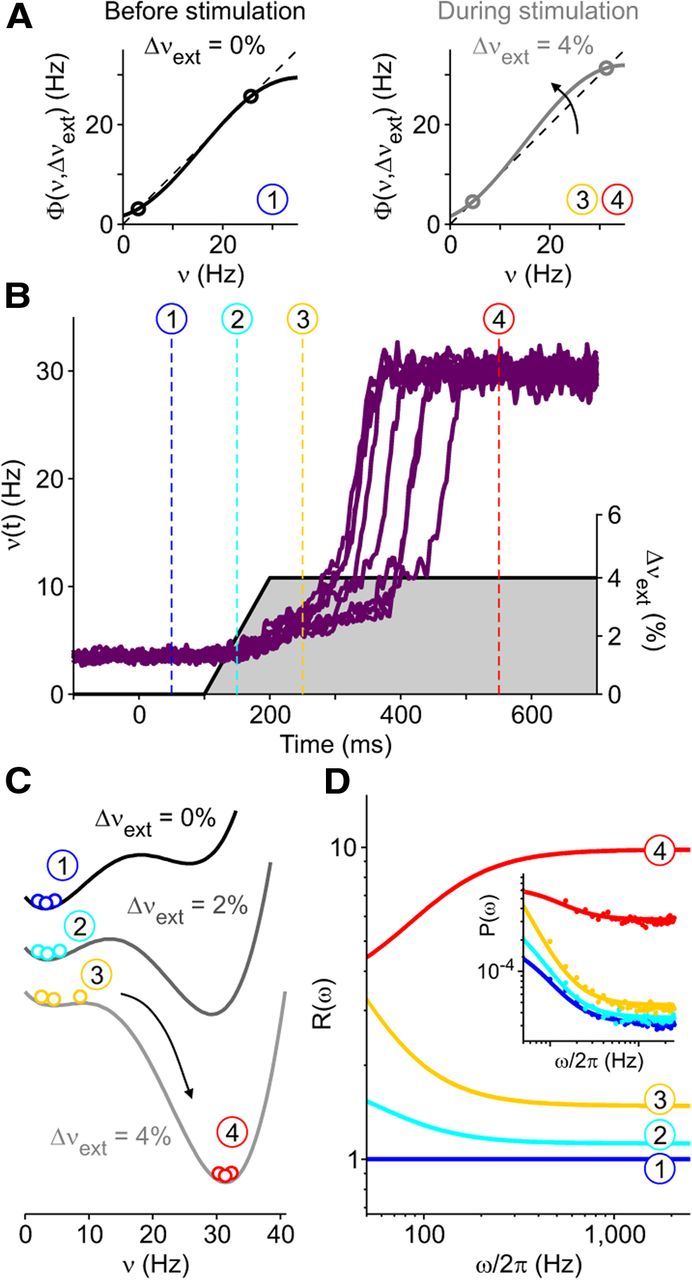
Spectral modulation of activity in a bistable minimal model showing SUT. A, Example gain functions Φ(ν,Δνext) driving the minimal rate model dynamics when different additional external inputs Δνext are delivered (solid curves). The dashed black line indicates where input and output rates are equal. Circles, Stable fixed points of the dynamics where input equals output firing rate (Φ(ν) = ν) and Φ′ = ∂Φ/∂ν < 1. B, Numerical integration of the minimal model dynamics around stimulation onset. Activity ν(t) fluctuates to mimic the intrinsic variability of a finite number of interacting neurons. Purple traces, ν(t) of 10 simulated trials (left axis); right axis, gray shaded Δνext modulating Φ and modeling the target-related input. Dashed vertical lines show four reference dynamical stages of modeled trials defined by the activity level and the Δνext value. C, Effective energy landscapes obtained integrating the “restoring” force Φ(ν,Δνext) − ν in the different reference stages. Bistability of the system is determined by the coexistence of two wells separated by an energy barrier. Colored circles represent ν(t) distribution in the reference periods in B. D, Relative power spectra R(ω) = P(ω)/Pref(ω) of ν(t) at different stages (Pref(ω), spectrum at stage 1). Inset, Power spectra P(ω) estimated from simulations (colored dots) and theoretical predictions (solid lines). Power spectral densities in Figure 4D were estimated from 5-s-long simulations of the rate model.
