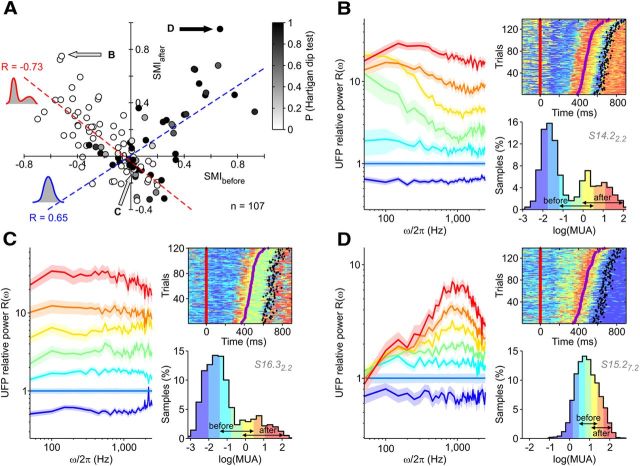
Figure 6.
Spectral modulations of in vivo UFPs confirm the theoretical attractor picture. A, SMIs for the selected recordings and conditions with predictive SUTs (n = 107, as in Fig. 2, D and E). SMIs are computed as in Figure 5, with activity levels before and after SUTs as labeled on the histograms. The dashed red line indicates linear regression (r = −0.73, p < 0.001) for recordings with bimodal activity histogram during RT (red circle; p < 0.05, Hartigan's dip test; n = 57 of 107; see also Fig. 9A). The dashed blue line indicates linear regression (r = 0.65, p < 0.001) for recordings/conditions with unimodal activity histograms (black circle; dip test, p ≥ 0.05; n = 50 of 107). B–D, Spectral modulations as in Figure 5, C and D, for representative recordings/conditions marked by arrows in A. Other conventions and symbols are as in Figures 2, 3, and 5.

