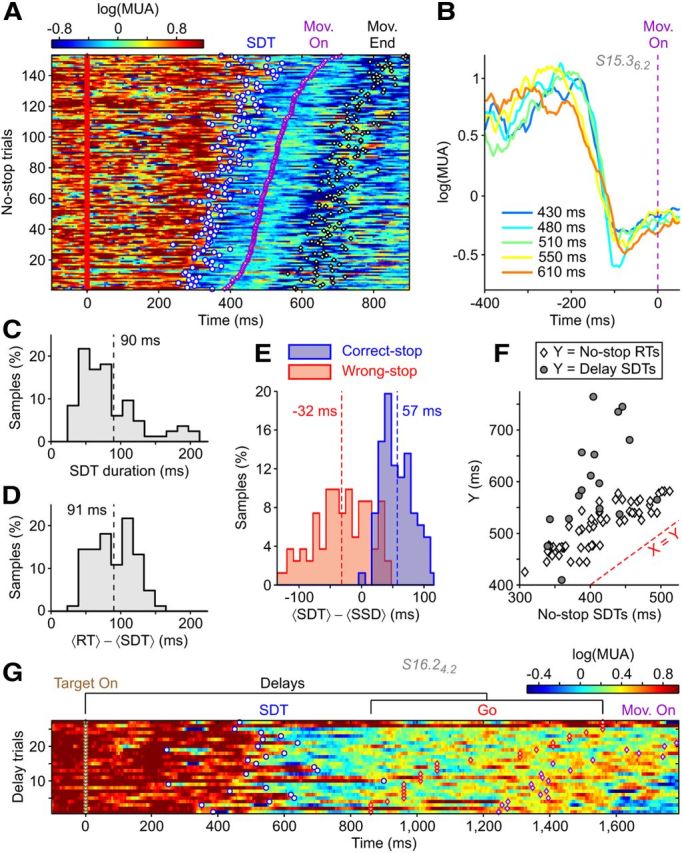
Figure 7.

Sharp downward transitions also code motor plans at the single-trial level. A, Raster plot of log(MUA) as in Figure 2A from a representative extracellular recording and target position showing SDTs (circles) from Up (reddish) to Down (bluish) states in No-stop trials. B, Average of log(MUA) across trials in A grouped by RT (inset, average RT in each group) and aligned to movement onsets (dashed line). C, D, Histograms of the average SDT durations (C) and average time lags between SDT and RT end (D) (n = 83 recordings/conditions). E, As in Figure 3C, histograms of average latencies between SDTs and SSDs for Correct-stop (blue) and Wrong-stop (red) trials in the same recordings/conditions (n = 83). Dashed lines show population averages. F, Correlation between average SDT times and average RTs during No-stop trials (white diamond, n = 83) and average SDTs in the Delay trials (gray circle, the subset n = 17 of recordings/conditions showing SDTs both in stop-signal and delayed reaching tasks). G, Raster plot of log(MUA) aligned to Target on (brown diamonds) for Delay trials from an example recording/condition showing SDTs. Mov. On, movement onset; Mov. End, movement end.
