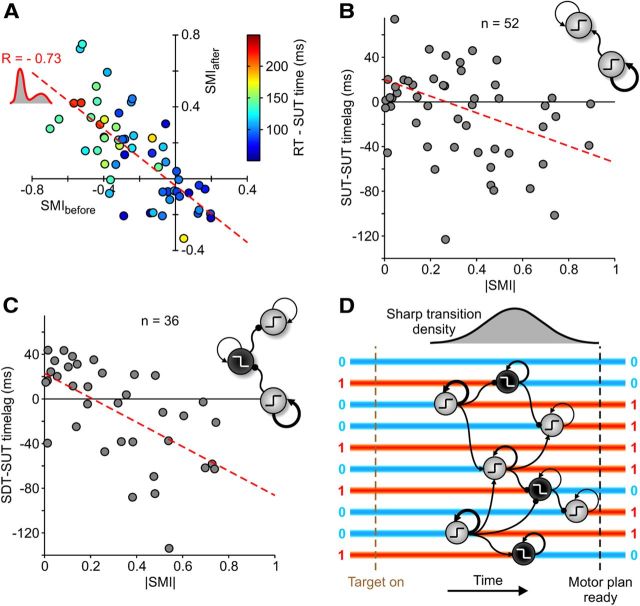
Figure 9.
Motor programs mature as sequences of MUA STs in PMd. A, Correlation plot between SMIs as in Figure 6A for recordings/conditions with only bimodal distribution of MUA during RTs (dip test, p < 0.05; n = 57 of 107). Circle colors indicate average time lags between RTs and SUT times (see color bar). B, Average latency between SUT times in each recording/condition in A and SUTs simultaneously detected in other channels of the multielectrode array used (n = 52 of 57; those with SUTs in at least two electrodes and two outliers not shown). The dashed line indicates linear regression (y = −74x + 20 ms, p < 0.01). Inset, Cortical modules with larger |SMI|, and hence larger self-excitation, are likely activated earlier. C, As in B, the average latency between SUT times and SDTs simultaneously detected (n = 36 of 57). The dashed line indicates linear regression (y = −109x + 23 ms, p < 0.001). Inset, Graph depicting a possible ordered inhibitory chain of cortical modules in which SUTs in modules with larger |SMI| prime SDTs and then SUTs in other modules. D, A possible scenario of motor plan maturation. Before target onset, PMd stays in a stable state with active (1) and inactive (0) cortical modules. After a random delay, some modules with strong self-excitation have SUTs priming a chain reaction of STs in other modules and ending in a different stable multimodular activity pattern, the motor plan.

