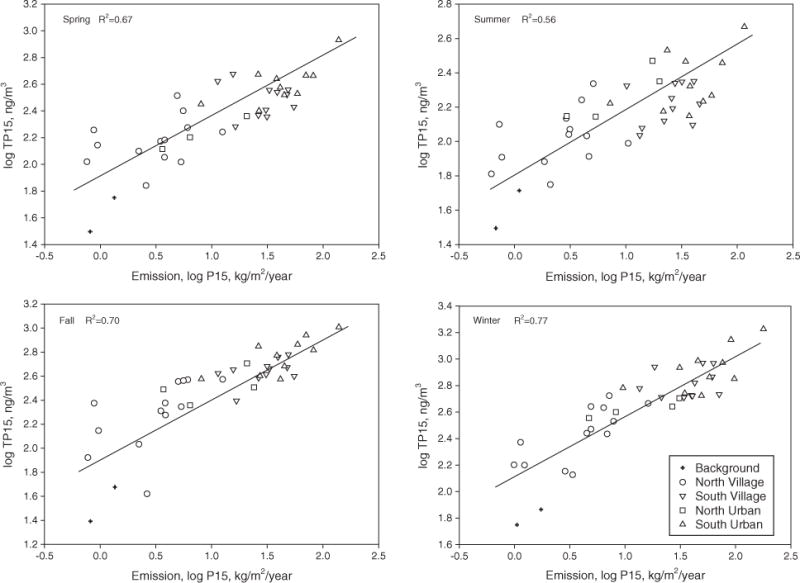
Fig. 1.

Scatter plots of ambient air PAH concentrations and PAH emission density in spring, summer, fall and winter. TP15 on the Y-axis represents the total PAH concentration (sum of gas-phase and particulate-phase concentrations of the 15 PAHs). P15 on the X-axis represents the emission density of the 15 PAHs.
