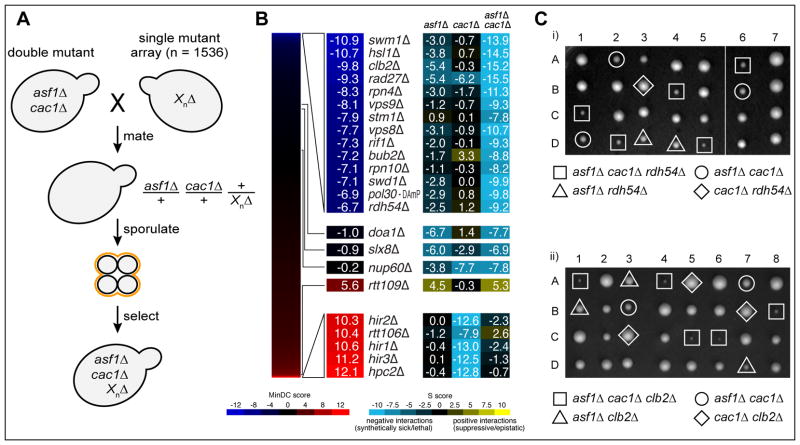
Figure 1. Triple mutant analysis of asf1Δ cac1Δ.
A) TMA using a strain deleted for both ASF1 and CAC1 crossed to a library of 1536 different mutants. The mutants represent all major biological processes, with a particular emphasis on chromatin biology (Ryan et al., 2012). Following mating, the diploid cells are sporulated and the triple mutant haploid strains are selected. B) Double and triple mutant S-scores range from positive (yellow) to negative (blue). A minimum difference comparison was obtained by subtracting the triple mutant S-score from the S-score of the more severe of the two double mutant combinations. MinDC scores range from positive (red) to negative (dark blue). C) Meiotic tetrad dissection yields the triple mutants asf1Δ cac1Δ radh54Δ and asf1Δ cac1Δ clb2Δ, as well as all corresponding double mutants.

