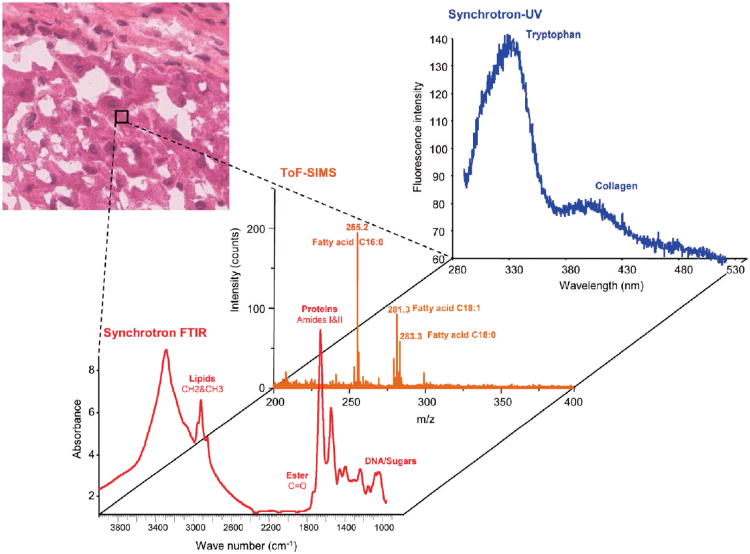
Figure 1.
Illustration of the combination of multimodal microspectroscopies from a single small region of liver tissue. The spectra represent multimodal data – synchrotron FTIR, TOF-SIMS, and synchrotron UV absorption – from a single region, pixel, of a liver sample. Multimodal spectra such as these presage heterocorrelated images in which every pixel in the image contains multiple spectra spatially registered and optimally scaled for high value added post-processing. Reprinted with permission. Adapted with permission from ref. 65, Copyright 2010 American Chemical Society.

