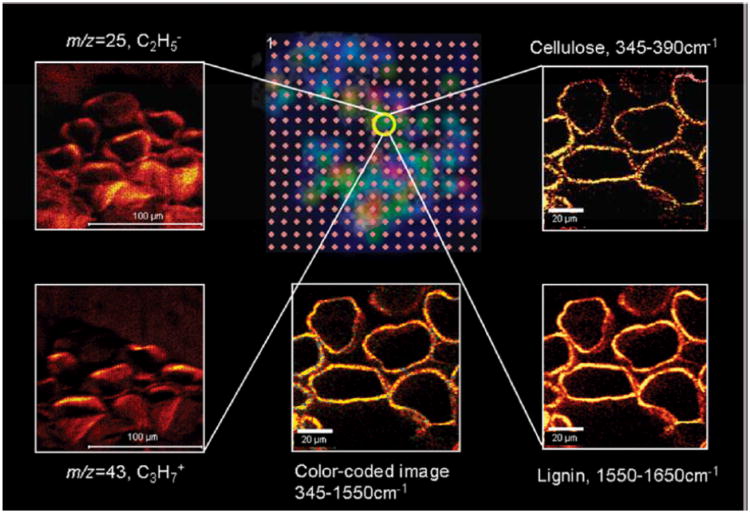
Figure 3.
Overview of LDI/SIMS/CRM heterocorrelated imaging applied to lignocellulosic materials. The LDI-MS grid (center top) is color-coded, corresponding to the intensity of m/z = 45 ions obtained by laser desorption-ionization excitation spots on 100 μm centers. The yellow circle highlights the spot where high resolution imaging was performed by both negative (m/z = 25, C2H-, top left) and positive (m/z = 43, C3H7+, bottom left) ion SIMS, as well as CRM, characterized by the cellulose band, 345 – 390 cm−1 (top right), and the lignin band, 1550 – 1650 cm−1 (bottom right). (Bottom center) Composite CRM image combining information from both cellulose (green) and lignin (yellow) bands. Adapted with permission from ref. 17, Copyright 2010 American Chemical Society.

