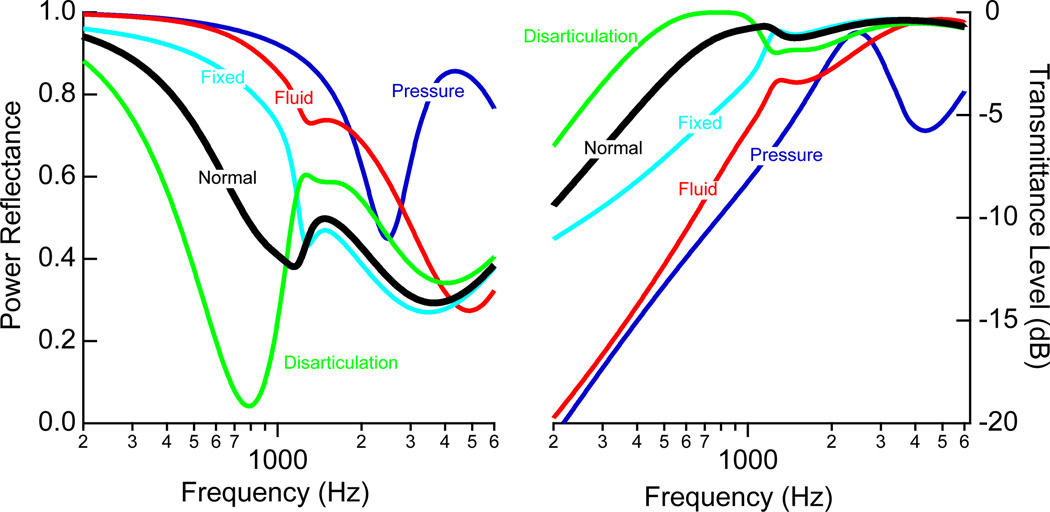
Figure 13.
Summary of the model predictions for power reflectance ℛ (left) and transmittance level T (right). The predictions correspond to the cases of: 0.1C for static pressure, 0.05C for middle-ear fluid, and 0.001C for stapes fixation. Tympanic-membrane perforations are not included here because both ℛ and T are heavily dependent on perforation size (see Fig. 12).

