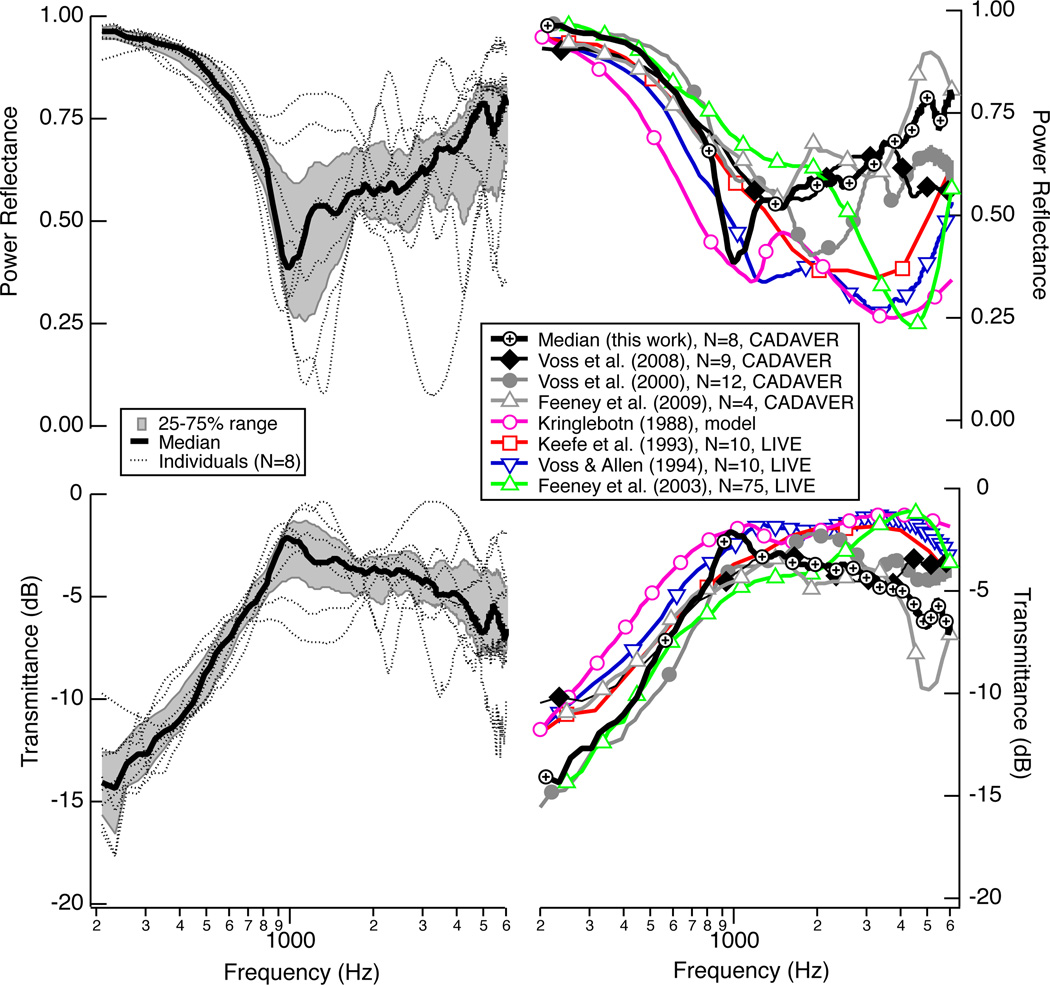
Figure 2.
LEFT: Power reflectance ℛ (upper) and transmittance T (lower) measurement made on eight cadaver ears in the normal state as part of this work. Within this population of eight ears are three sets of left and right ears from the same donor and two right ears from two different donors. Plotted here in thin dotted black lines is the initial normal measurement made at the beginning of each experiment. Plotted here as a thick black line is the median of these eight normal measurements, with the 25 percent to 75 percent range shaded gray. RIGHT Comparisons of the medians from the left (this work) with additional published results. For the Kringlebotn (1988) model, ℛ and T are calculated at the tympanic membrane.

