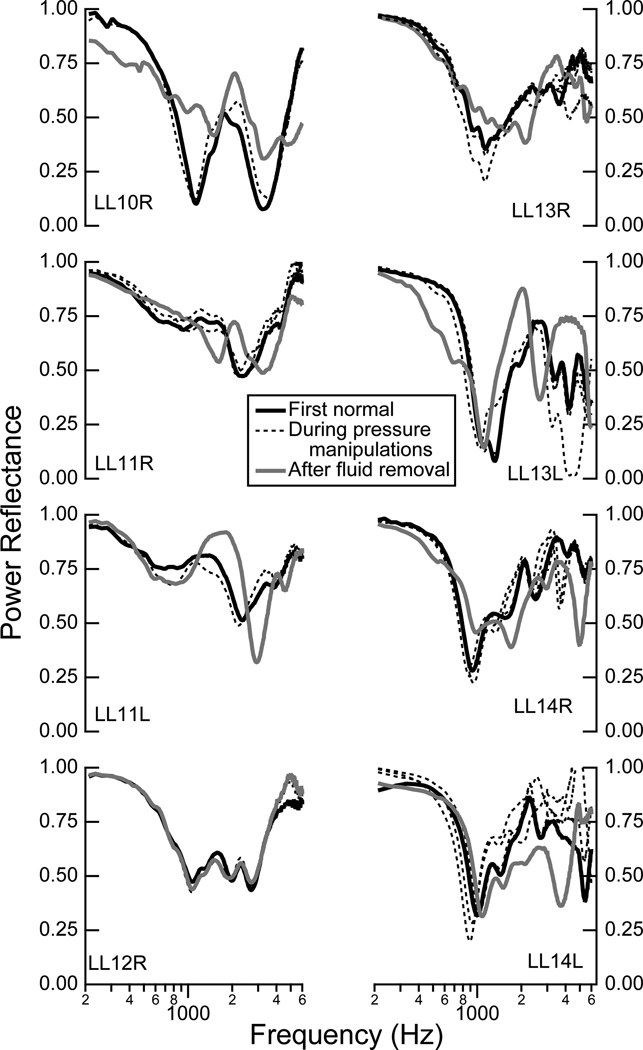
Figure 3.
Comparisons of the power reflectance ℛ made in the normal state at different points during the experiment for each individual ear: before any manipulations (solid black), during positive and negative pressure manipulations (dashed black), and after fluid was added and removed (solid gray). Alpha-numeric identifiers for individual ears are indicated within each plot (e.g., LL10R corresponds to the right ear R from life legacy (LL) donor number 10).

