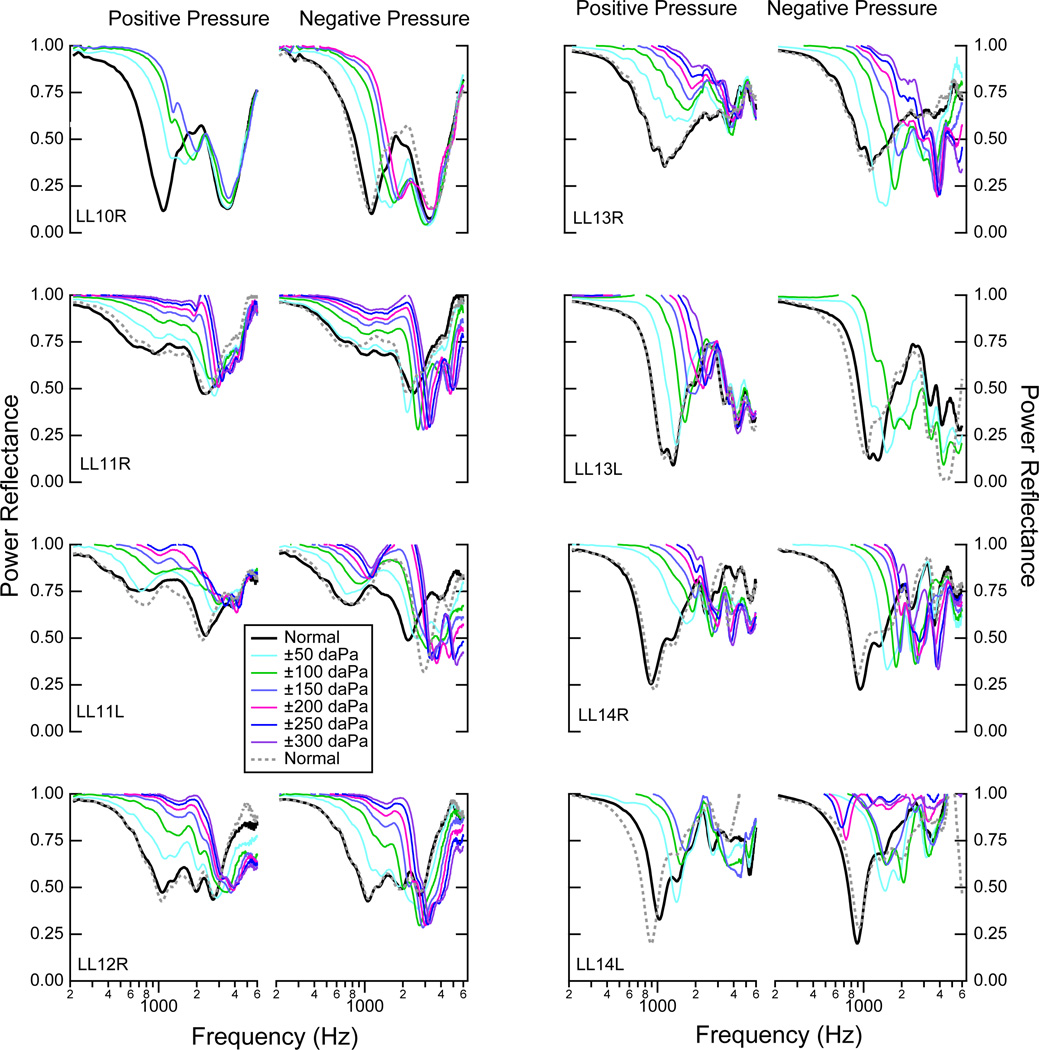
Figure 4.
Power reflectance ℛ measurements from eight ears for both positive static pressure (left columns) and negative static pressure (right columns), for pressures ranging from −300 to 300 dPa at increments of 50 dPa, as indicated by the legend. The initial normal measurement is represented by the solid black line, while the normal measurement made after the series of either positive or negative pressure manipulations is plotted as a dotted gray line, showing the extent to which the ear returned to the normal state after the pressure manipulations. In some cases there are not measurements for all of the static pressure range because acoustic leaks prevented the middle-ear cavity from maintaining the static pressures further from zero.

