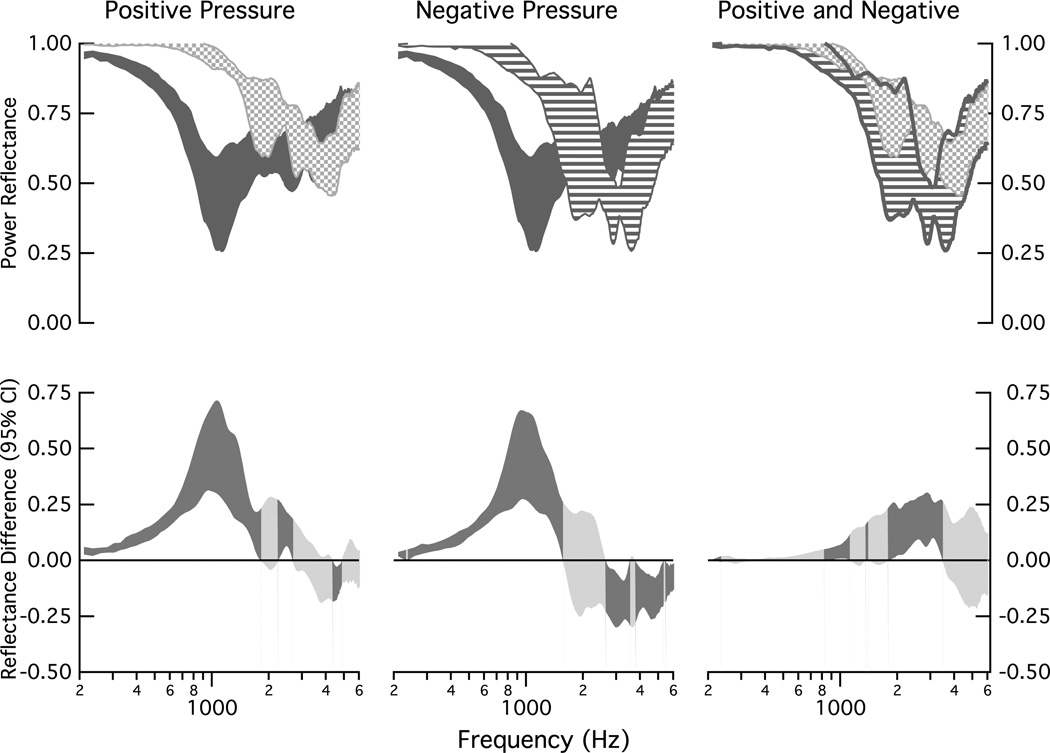
Figure 5.
Comparisons of population measurements of power reflectance ℛ under normal conditions and under middle-ear static pressures of ±150 daPa. Upper: All shaded regions represent the 25 to 75% range of data collected on the eight ears. The dark gray indicates the range for the ears in the normal condition, the speckled area indicates the range for +150 daPa (left and right plots), and the striped area indicates the range for the −150 daPa (center and right plots). Lower: Ninety-five percent confidence intervals computed for the mean of the difference between the eight matched measurements that defined each of the upper plots; dark shaded areas indicate regions where the mean difference differs from zero (ρ < 0.05) and lighter shaded areas indicate no difference from zero (ρ ≥ 0.05).

